Co-Presenting Partner


ASSOCIATE PARTNER
Bihar Election Infographics
Graphics that tell the story of the 2025 Bihar assembly elections
Our infographics make an already exciting Bihar election season even more interesting. A picture is worth a thousand words and an infographic can tell numerous stories. Explore the interesting election facets of Bihar through News18's continuing series of infographics.
#52NOVEMBER 15, 2025 | 19:07 IST
Bihar Elections 2025 - Seats Won
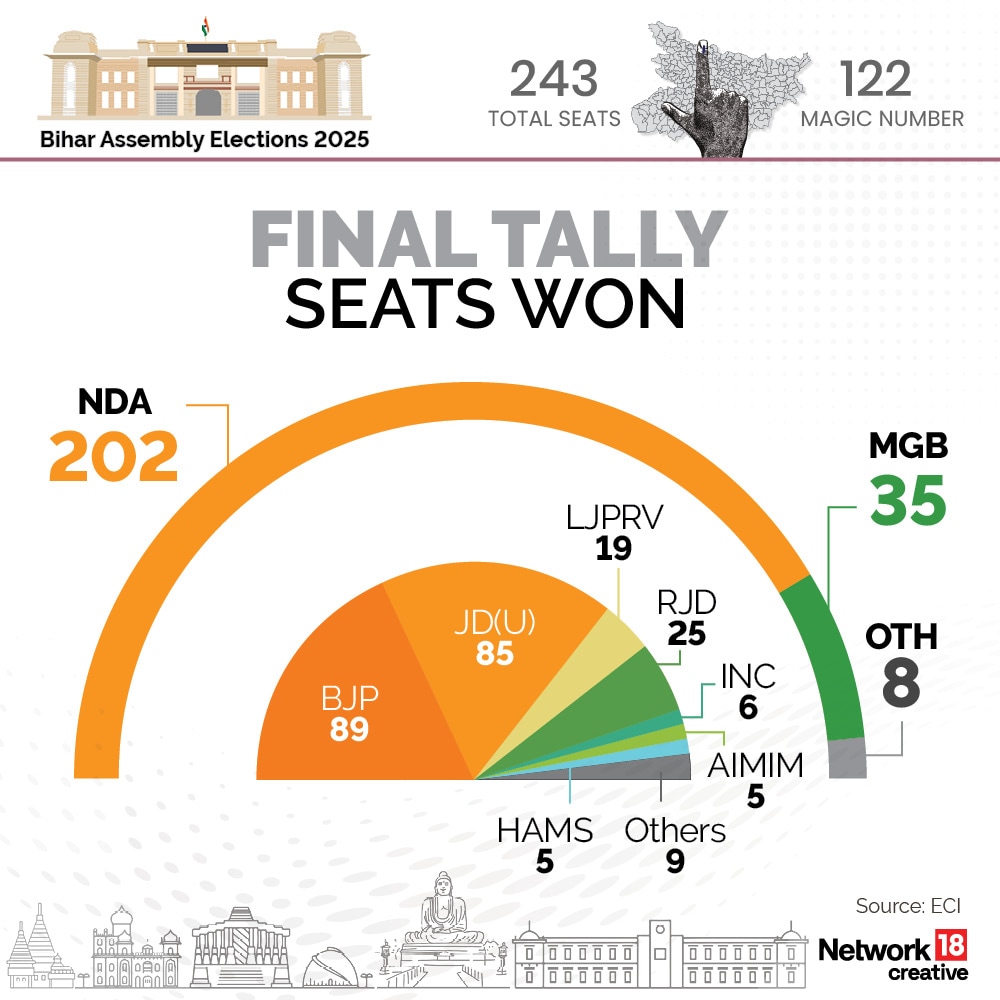
#51NOVEMBER 15, 2025 | 19:07 IST
Bihar Elections 2025 - Vote Share
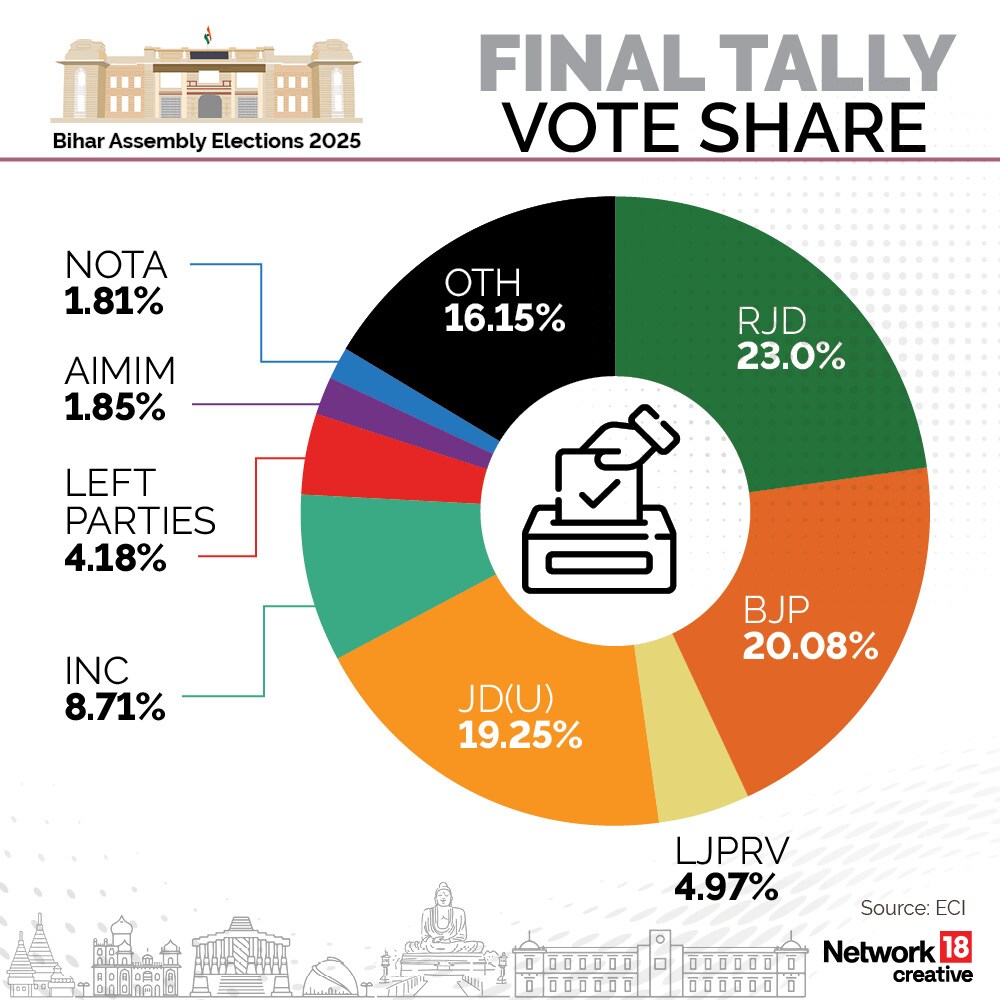
#50NOVEMBER 15, 2025 | 19:06 IST
Bihar Elections 2025 - Shades of Mandate
#49NOVEMBER 15, 2025 | 19:05 IST
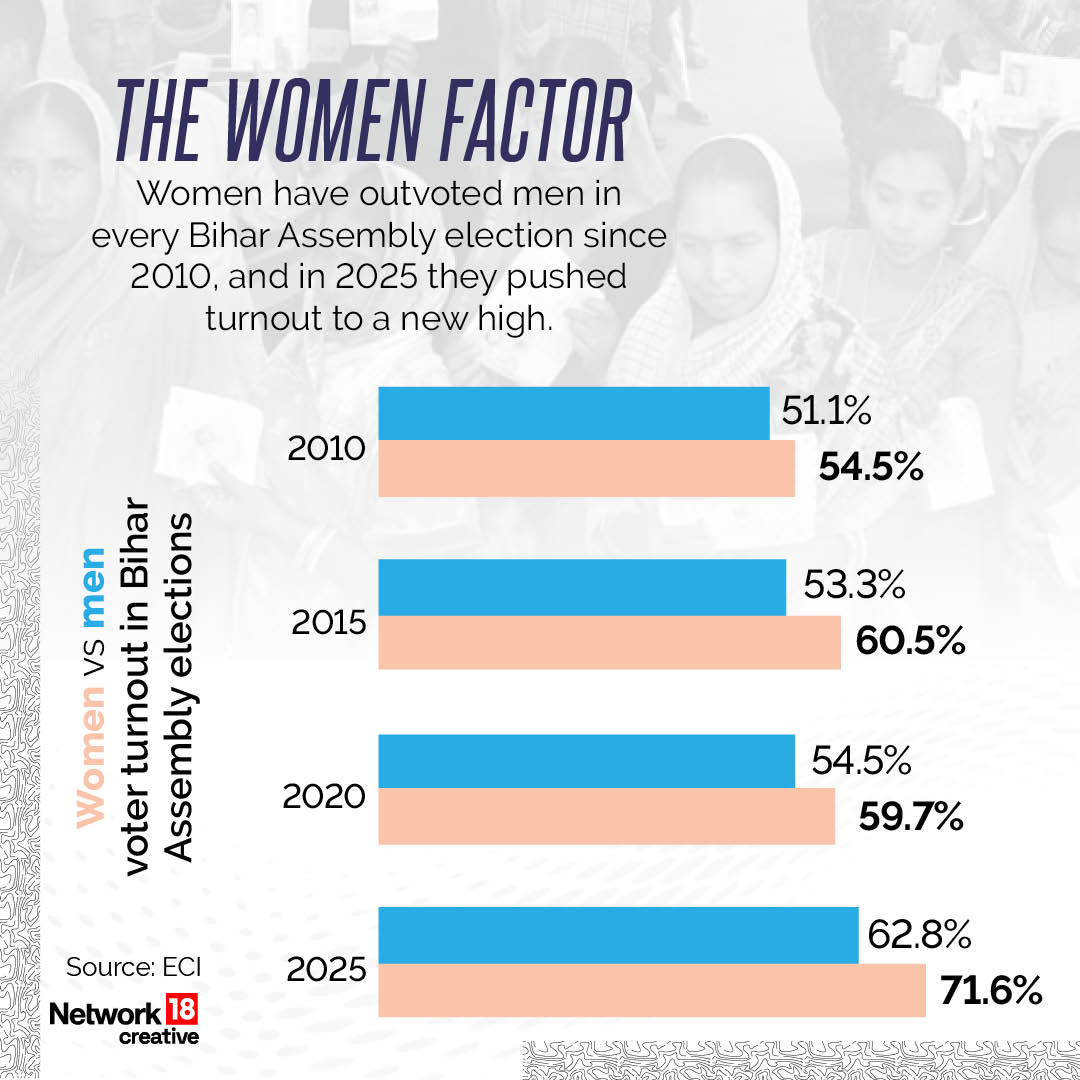
Bihar Elections 2025 - The Women Factor
#48NOVEMBER 15, 2025 | 19:05 IST
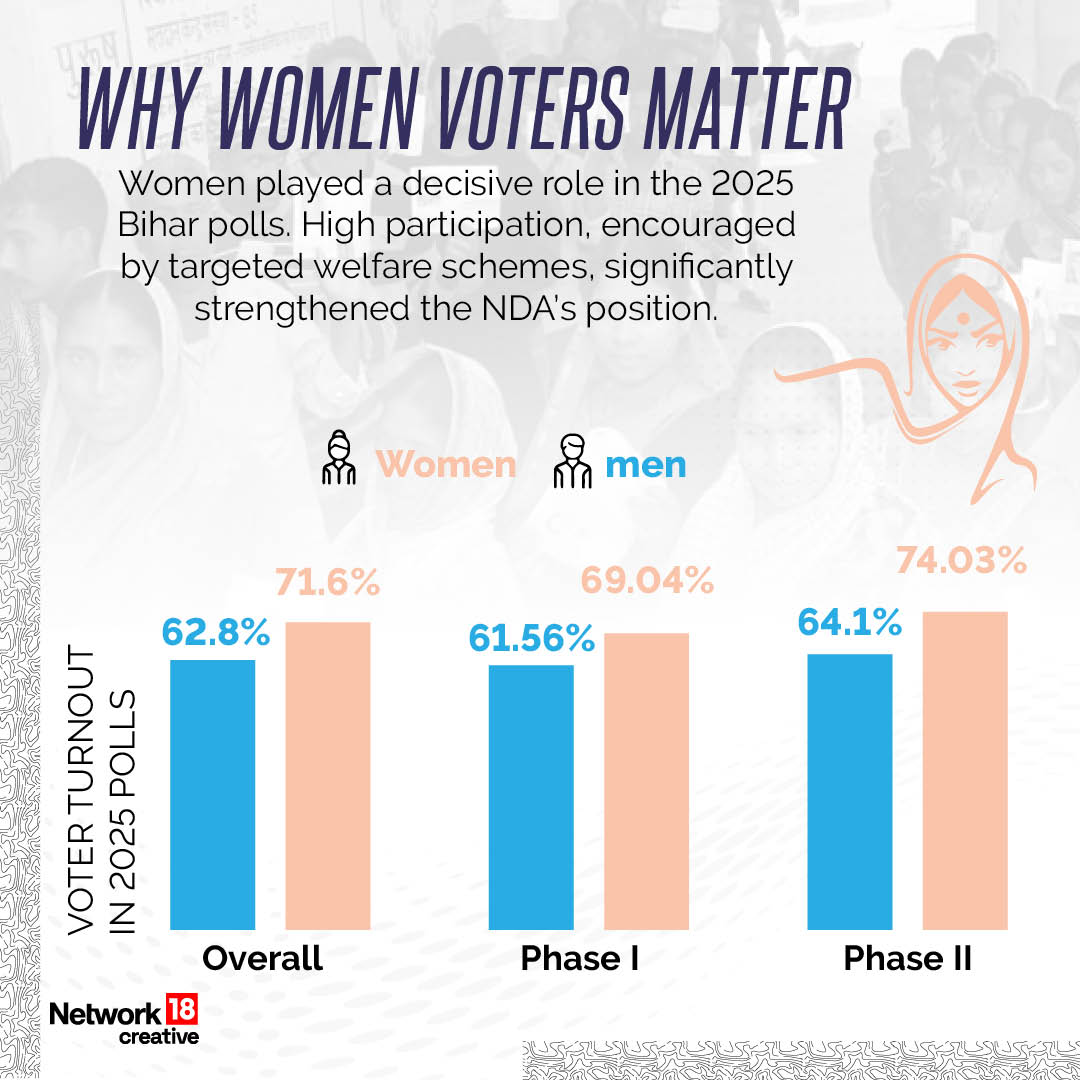
Bihar Elections 2025 - Why Women Voters Matter
#47NOVEMBER 15, 2025 | 19:04 IST
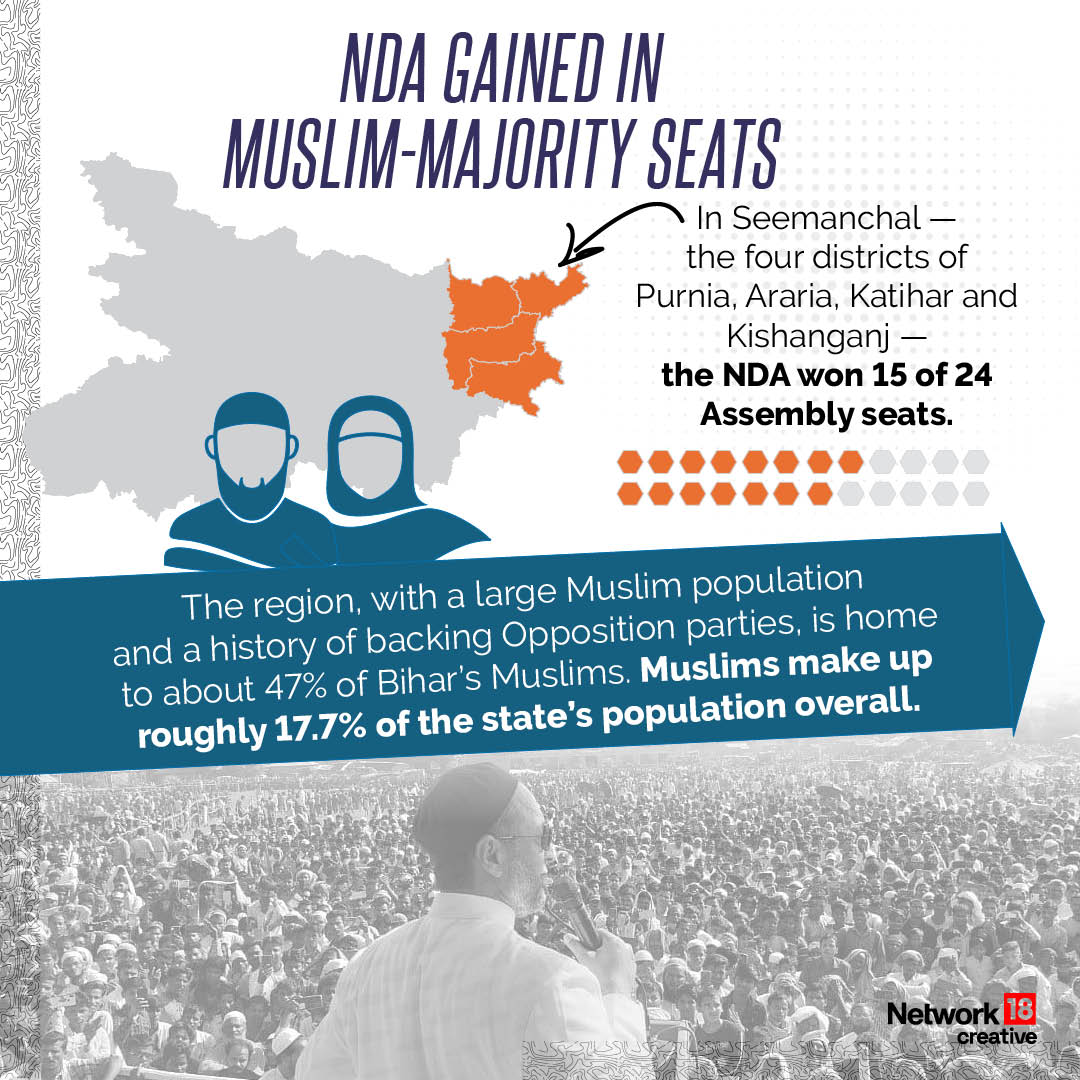
Bihar Elections 2025 - NDA Gained in Muslim-Majority Seats
#46NOVEMBER 15, 2025 | 19:04 IST
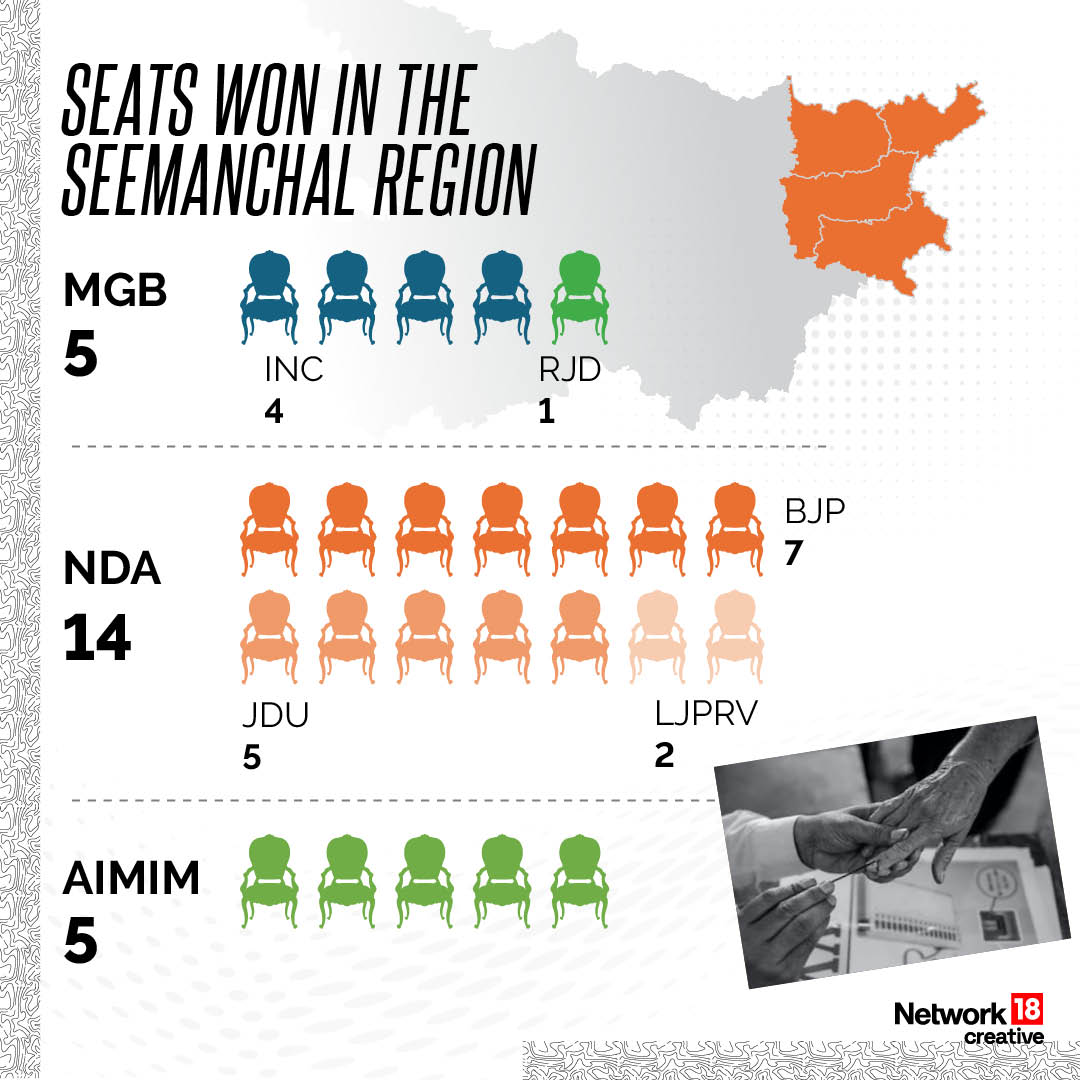
Bihar Elections 2025 - Seats Won in the Seemanchal Region
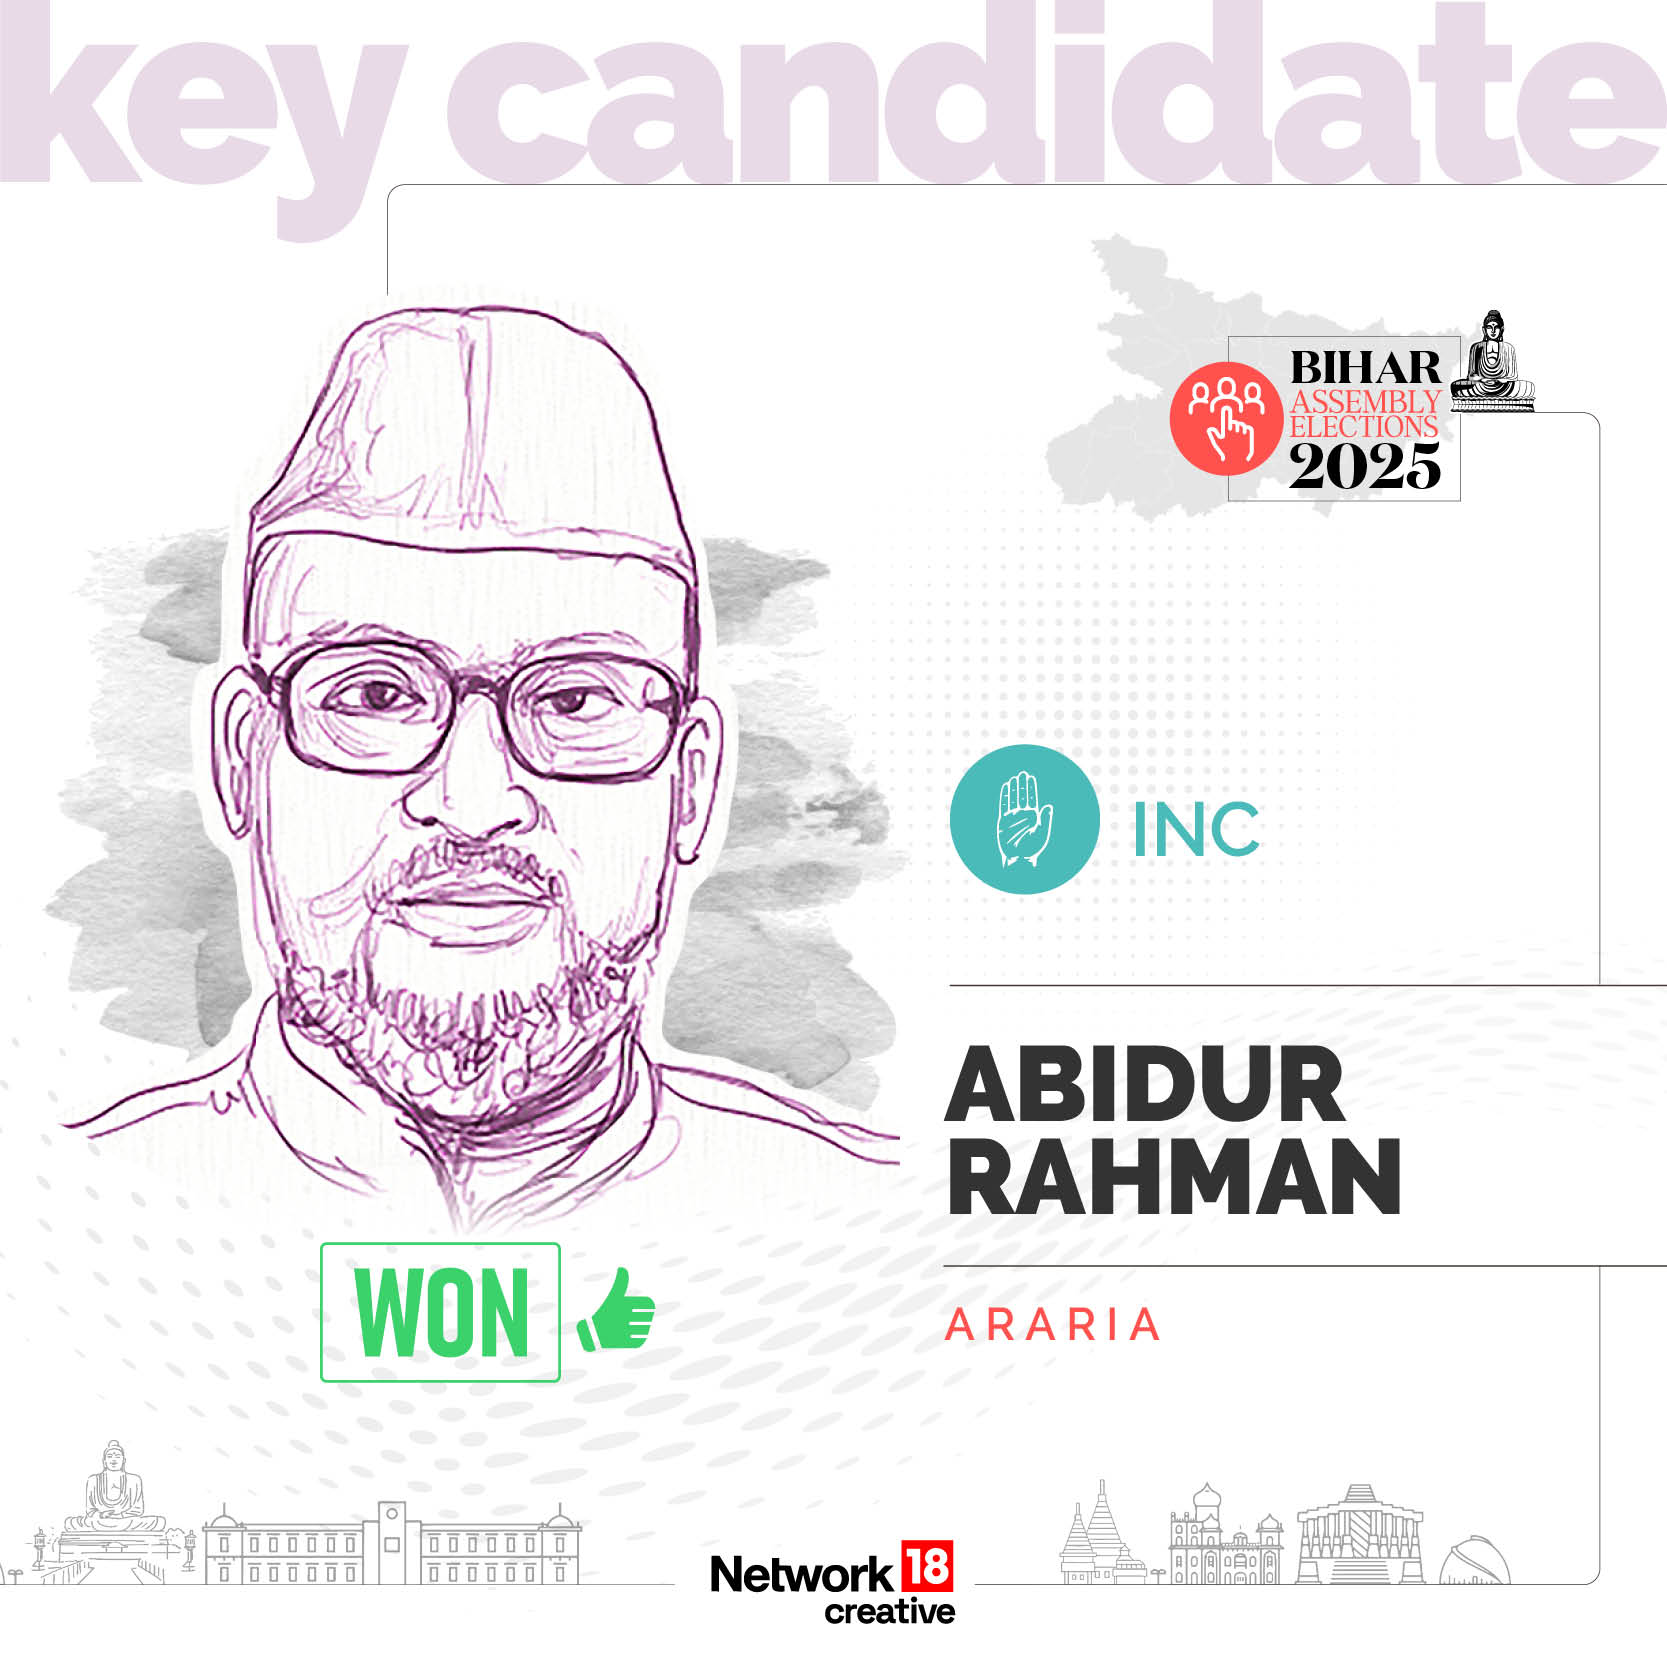
#45NOVEMBER 14, 2025 | 20:40 IST
Key Candidate - Abidur Rahman
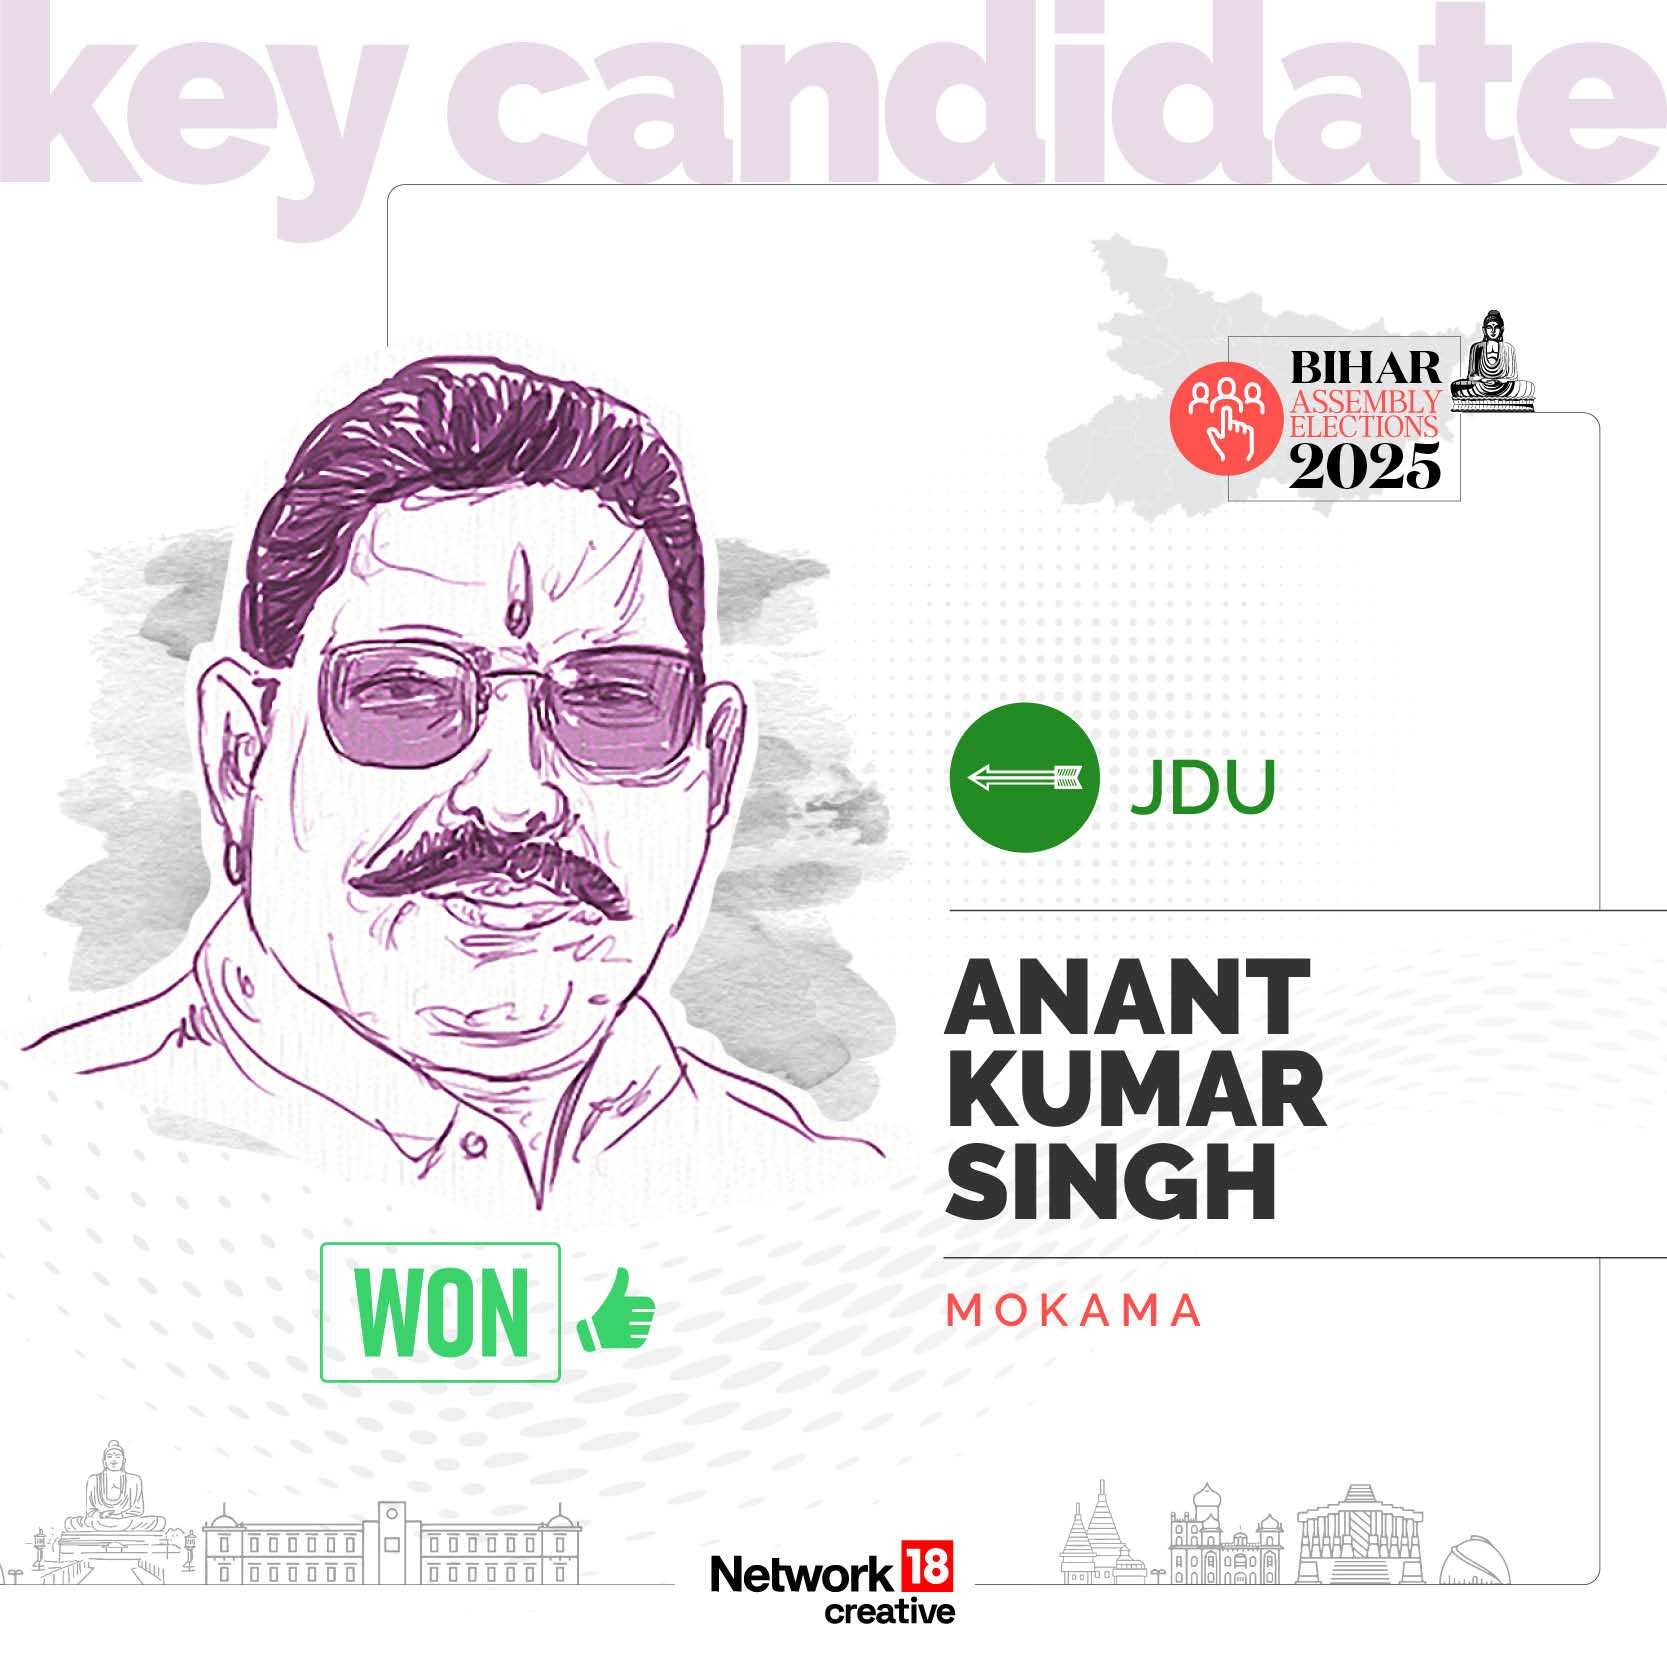
#44NOVEMBER 14, 2025 | 20:40 IST
Key Candidate - Anant Kumar Singh
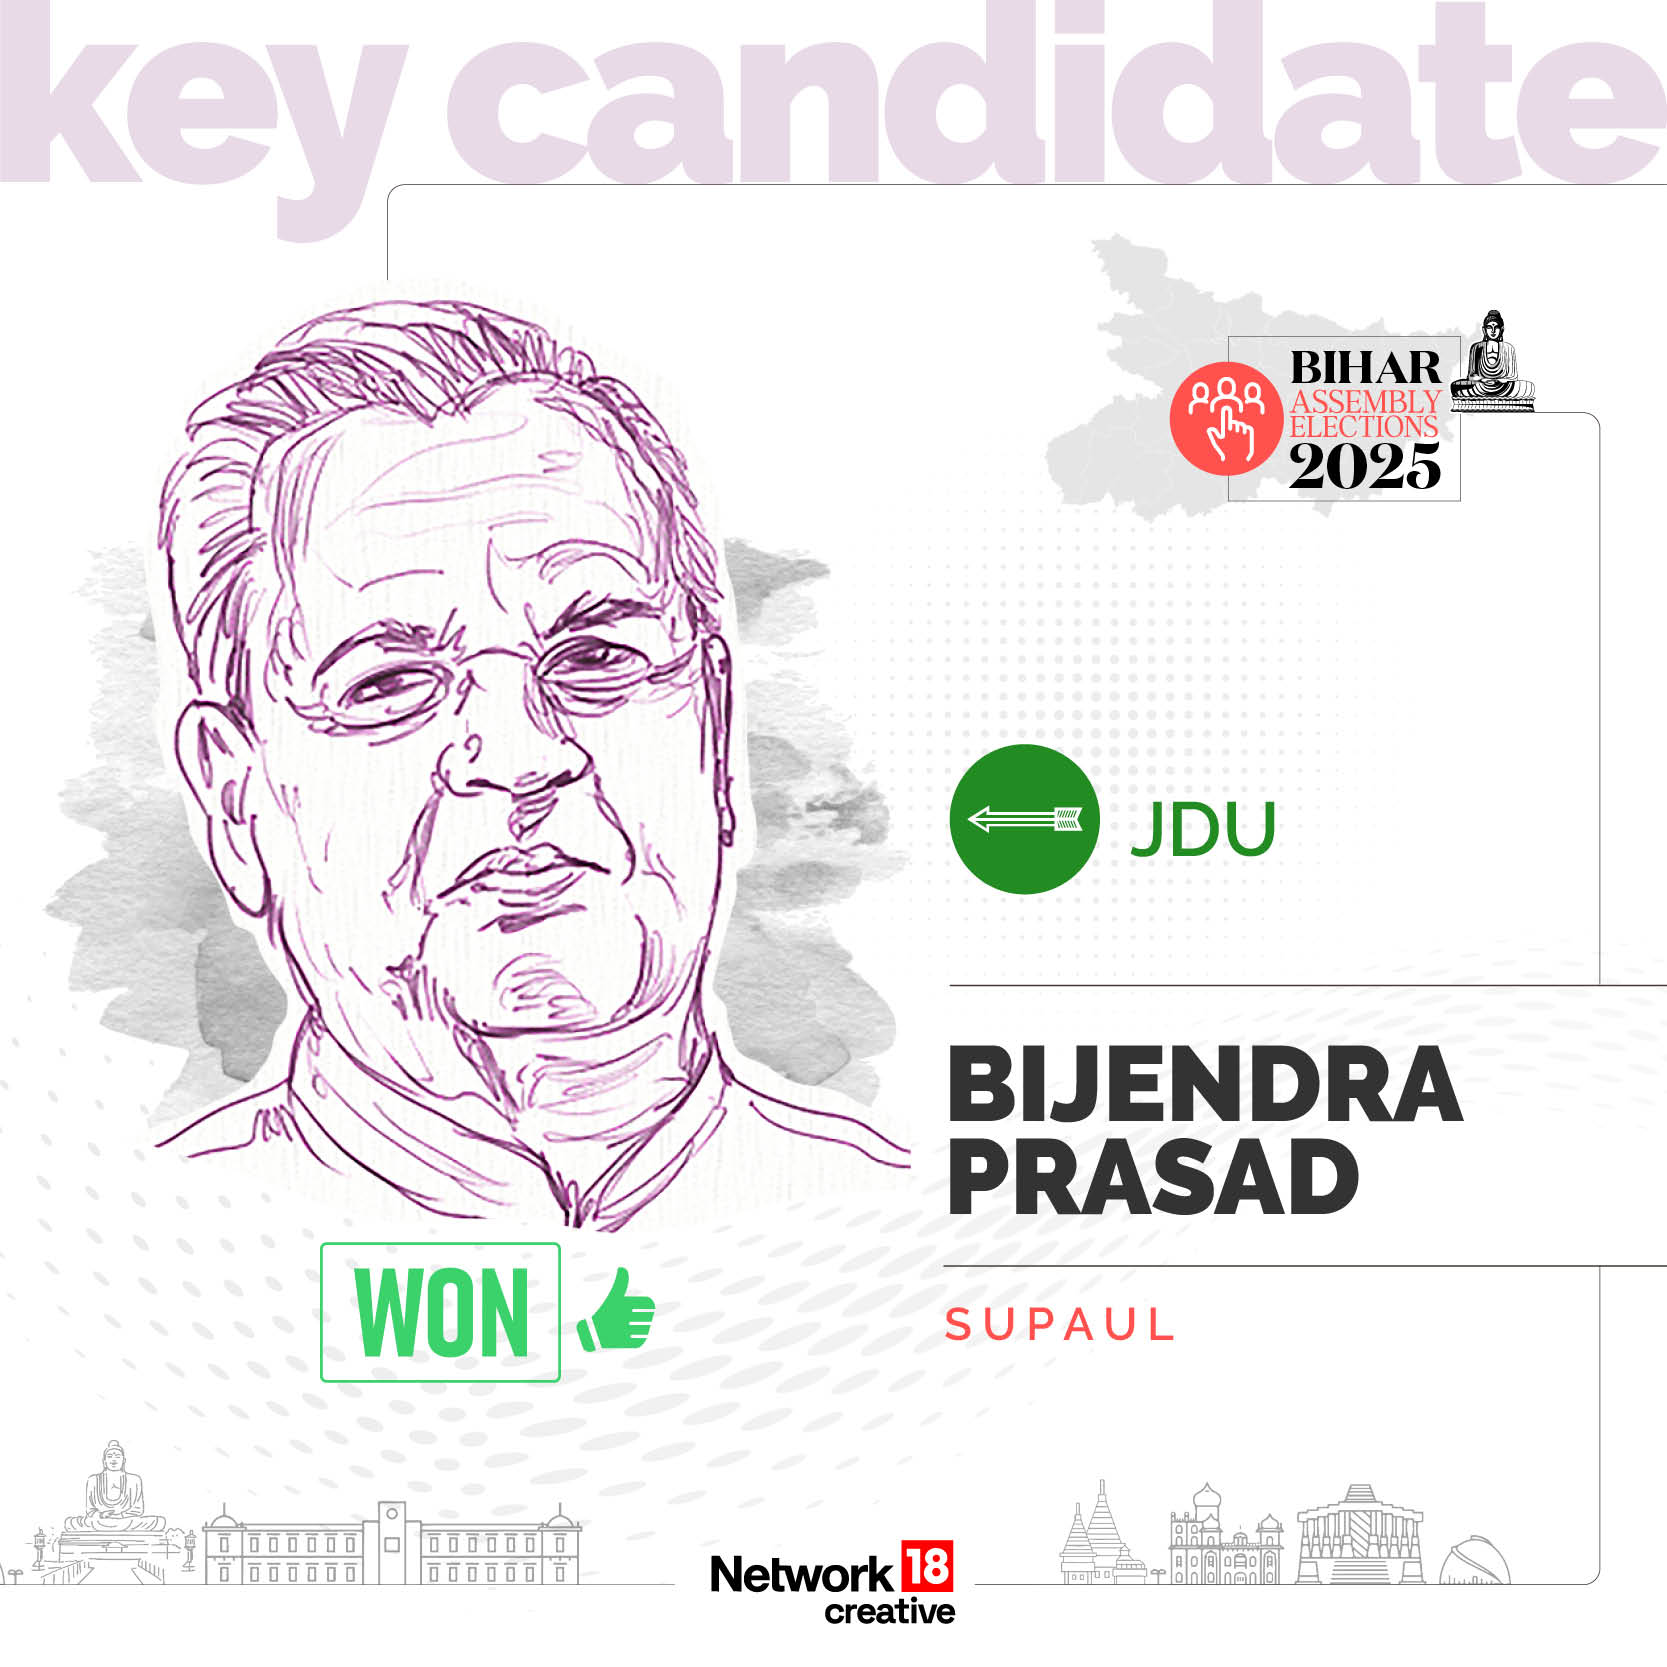
#43NOVEMBER 14, 2025 | 20:39 IST
Key Candidate - Bijendra Prasad Yadav
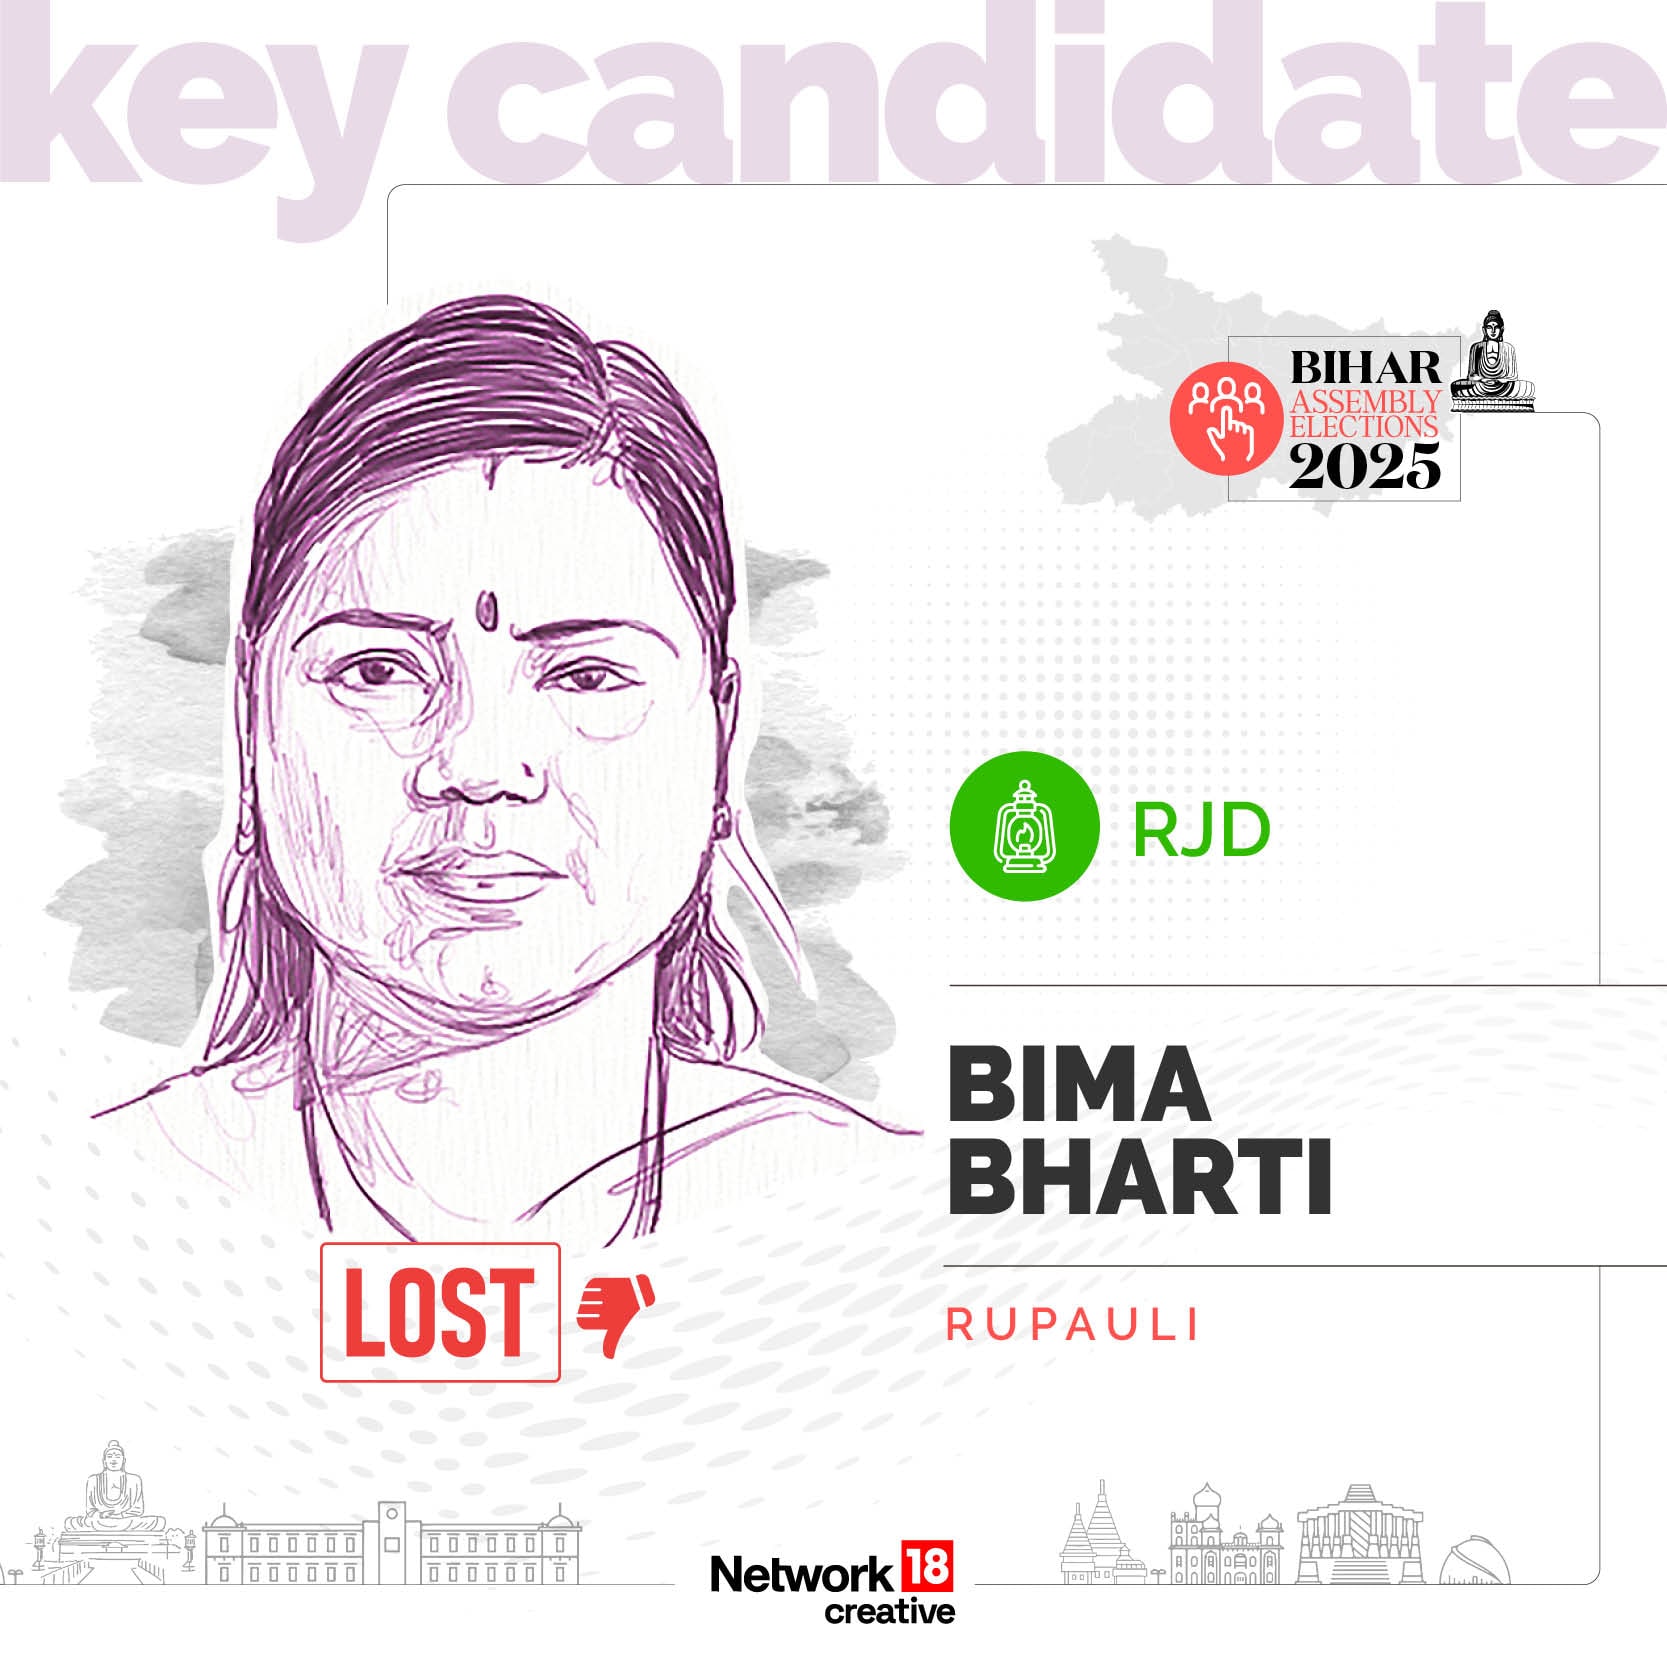
#42NOVEMBER 14, 2025 | 20:38 IST
Key Candidate - Bima Bharti
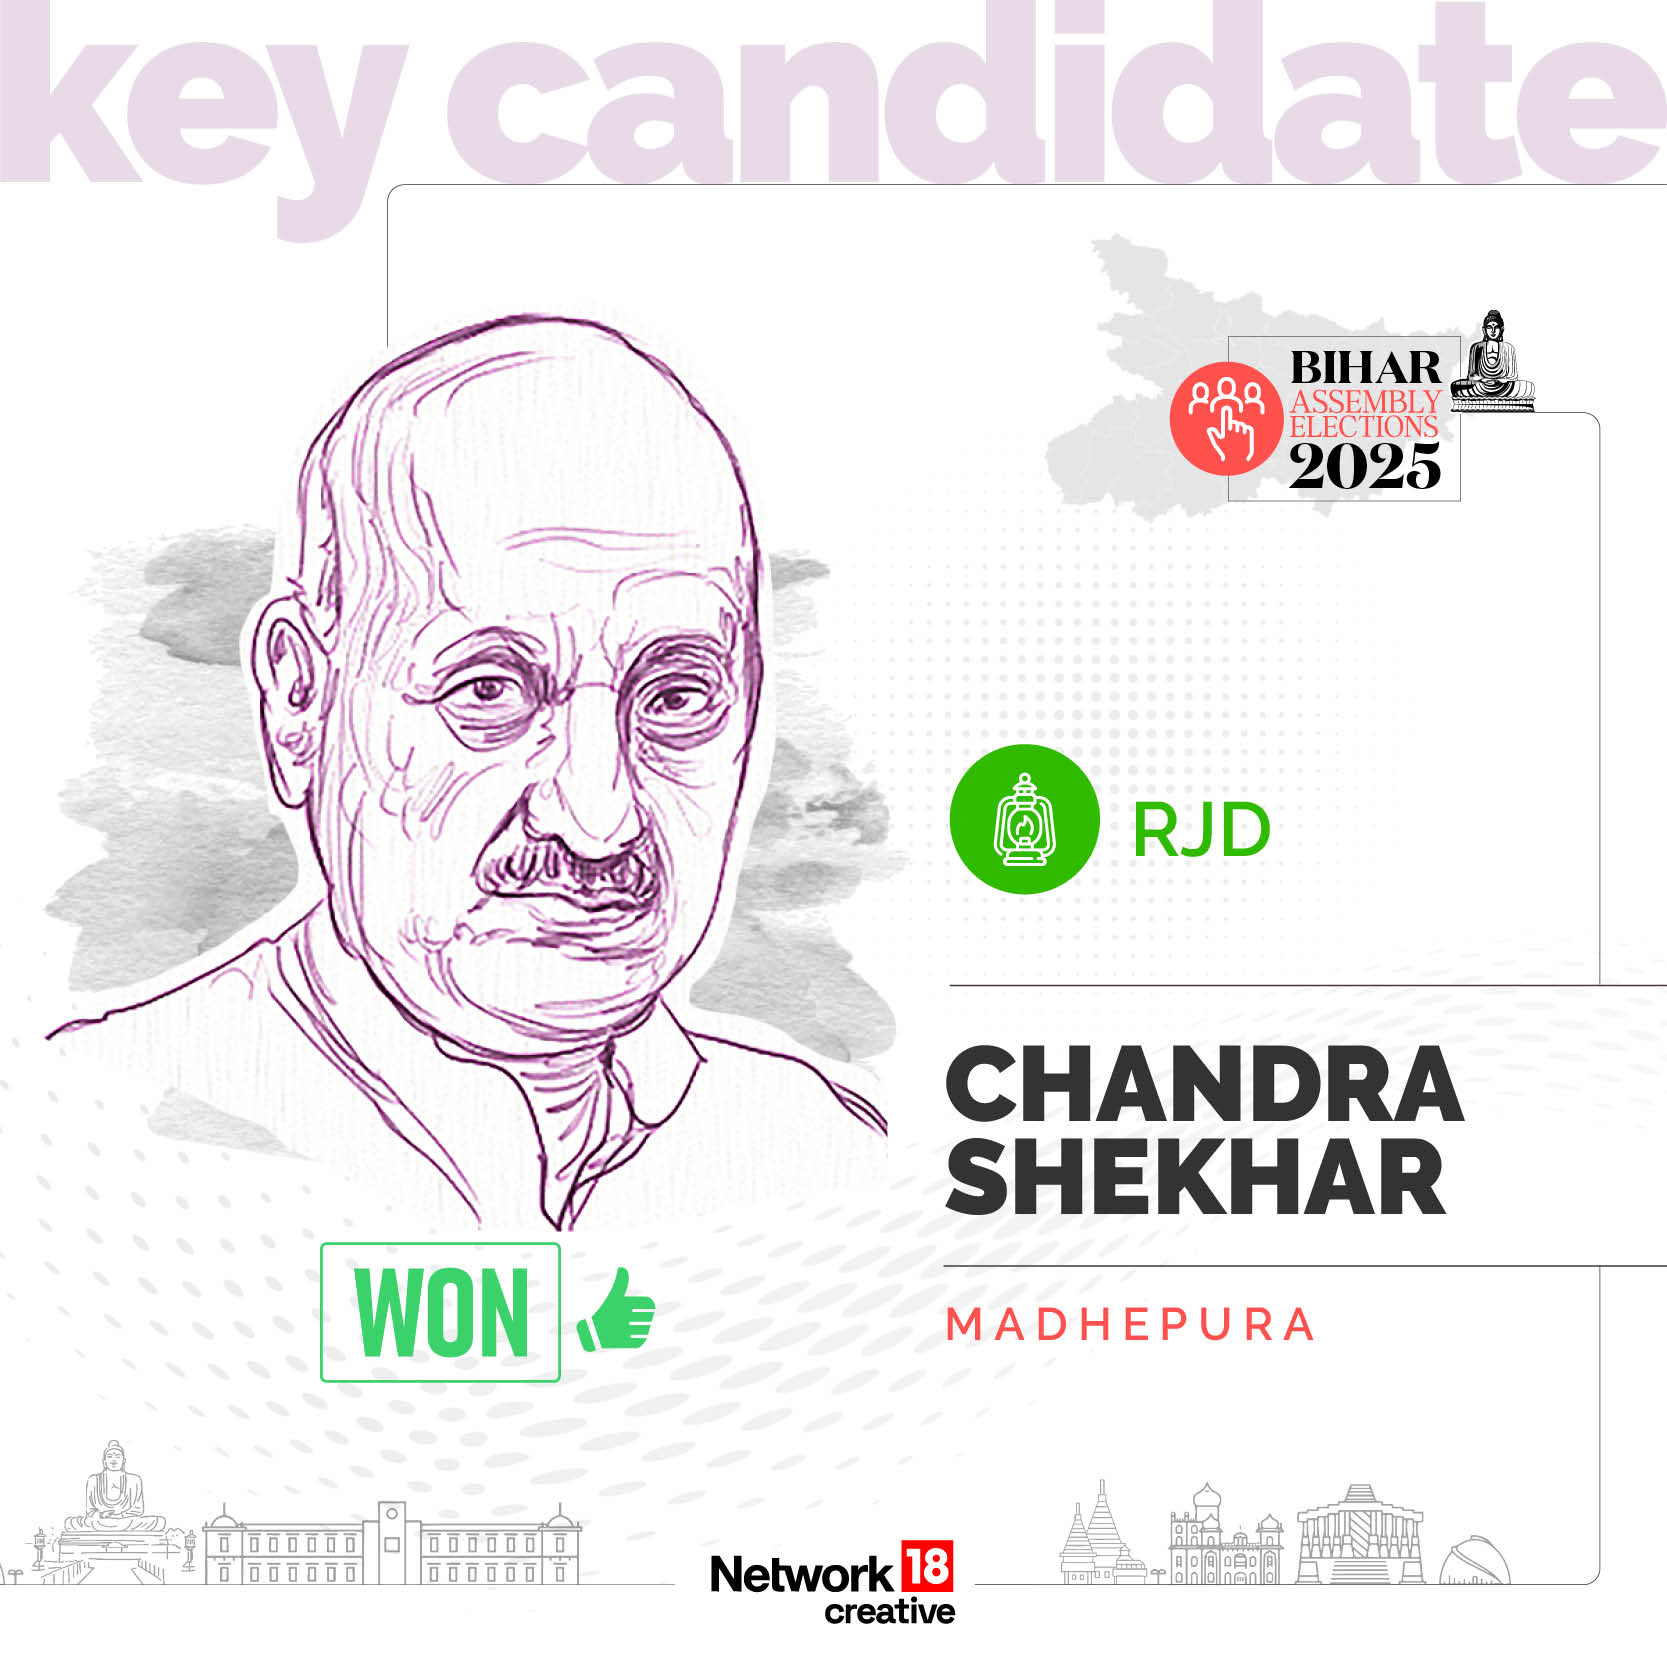
#41NOVEMBER 14, 2025 | 20:38 IST
Key Candidate - Chandra Shekhar
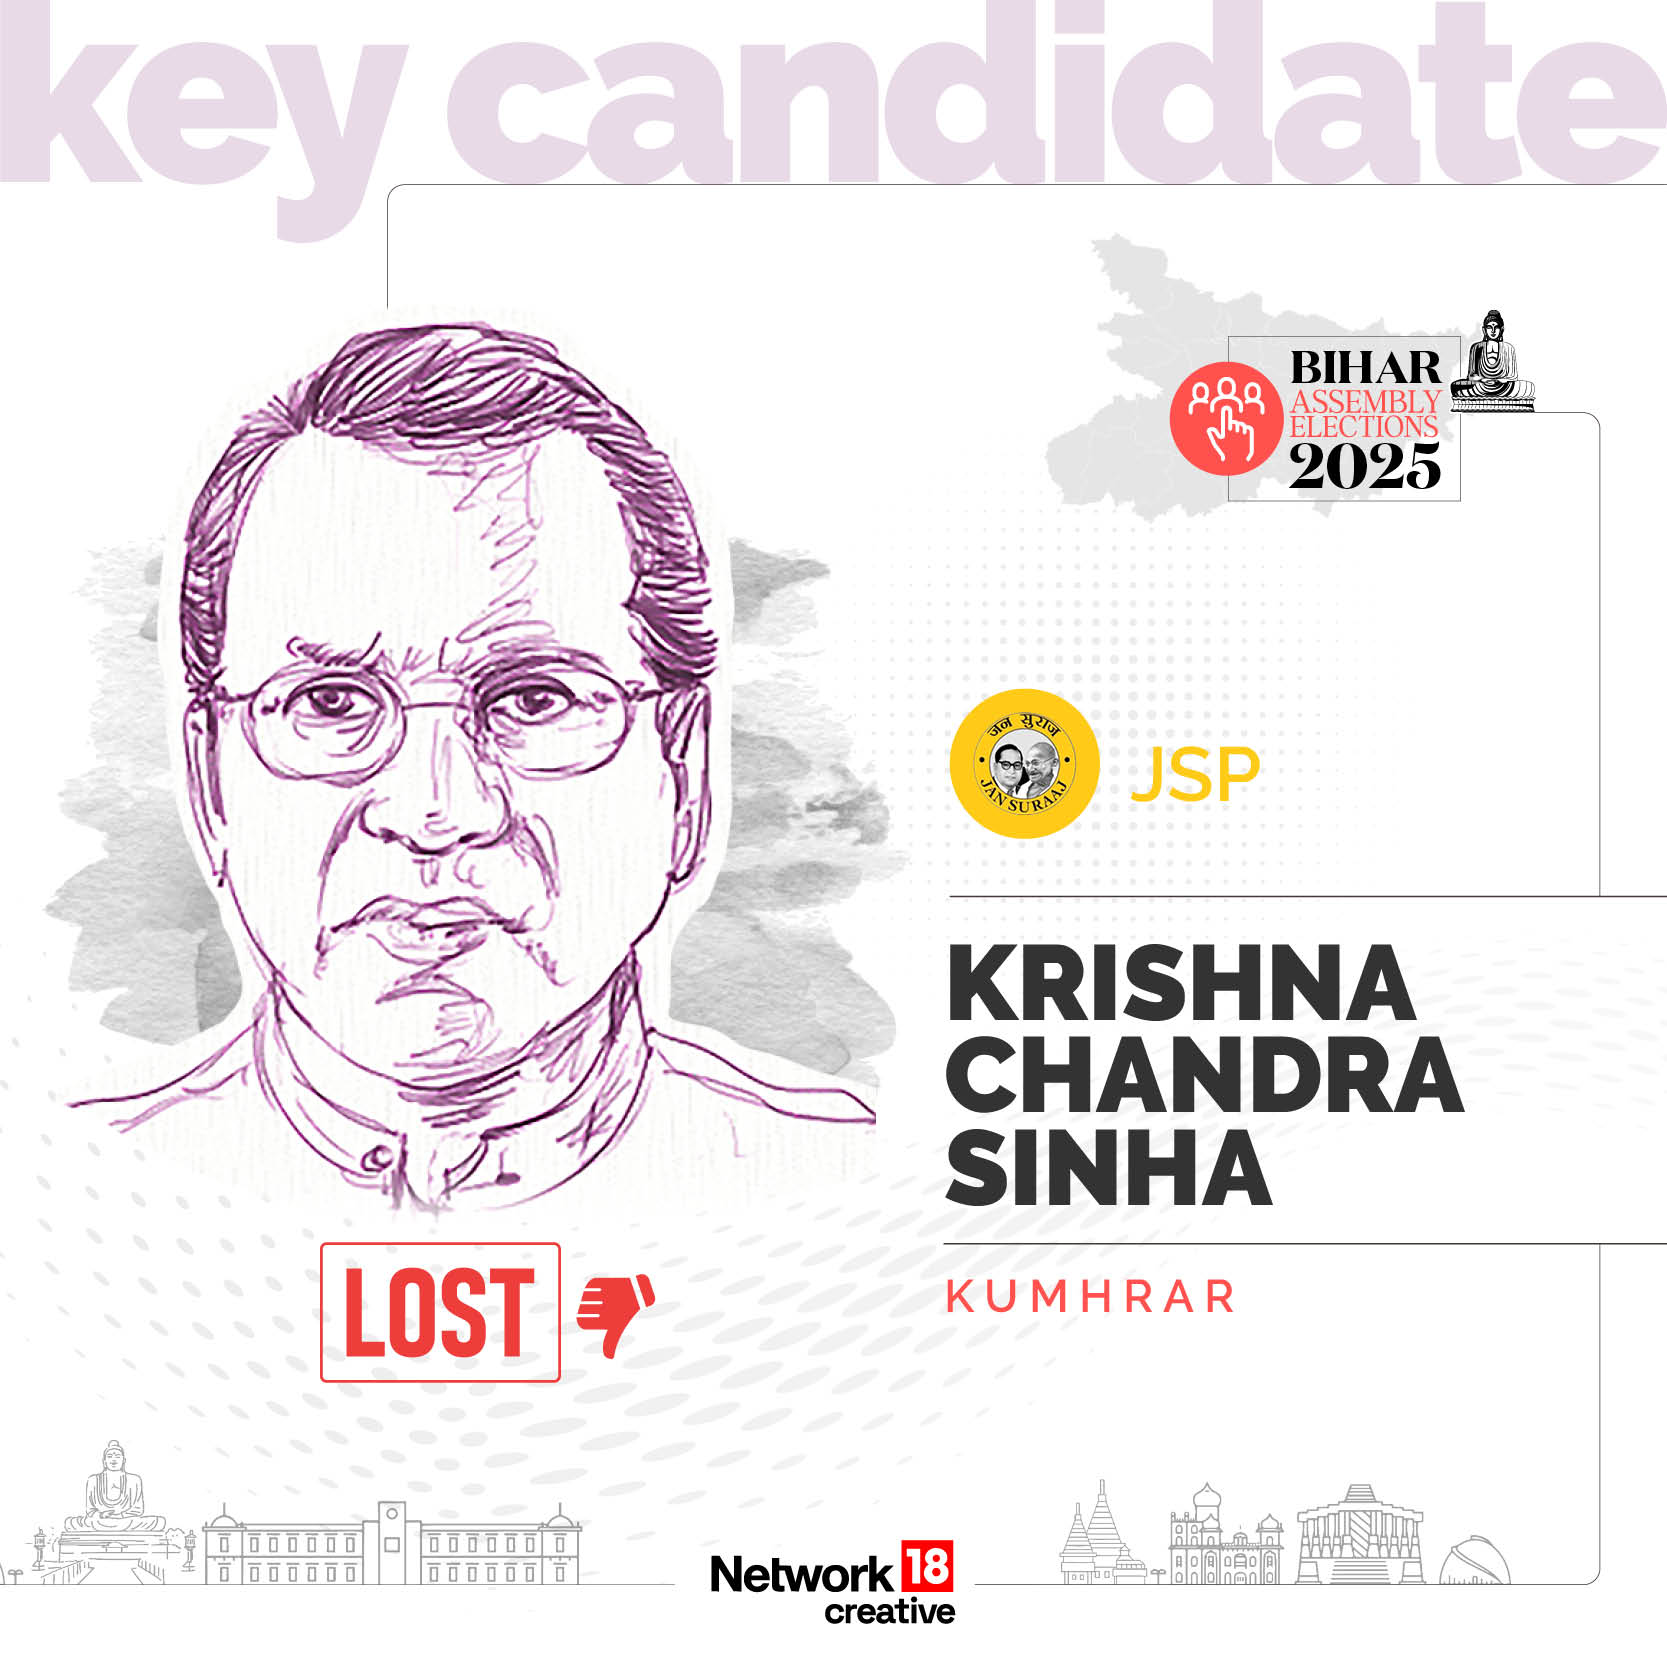
#40NOVEMBER 14, 2025 | 20:37 IST
Key Candidate - Krishna Chandra Sinha
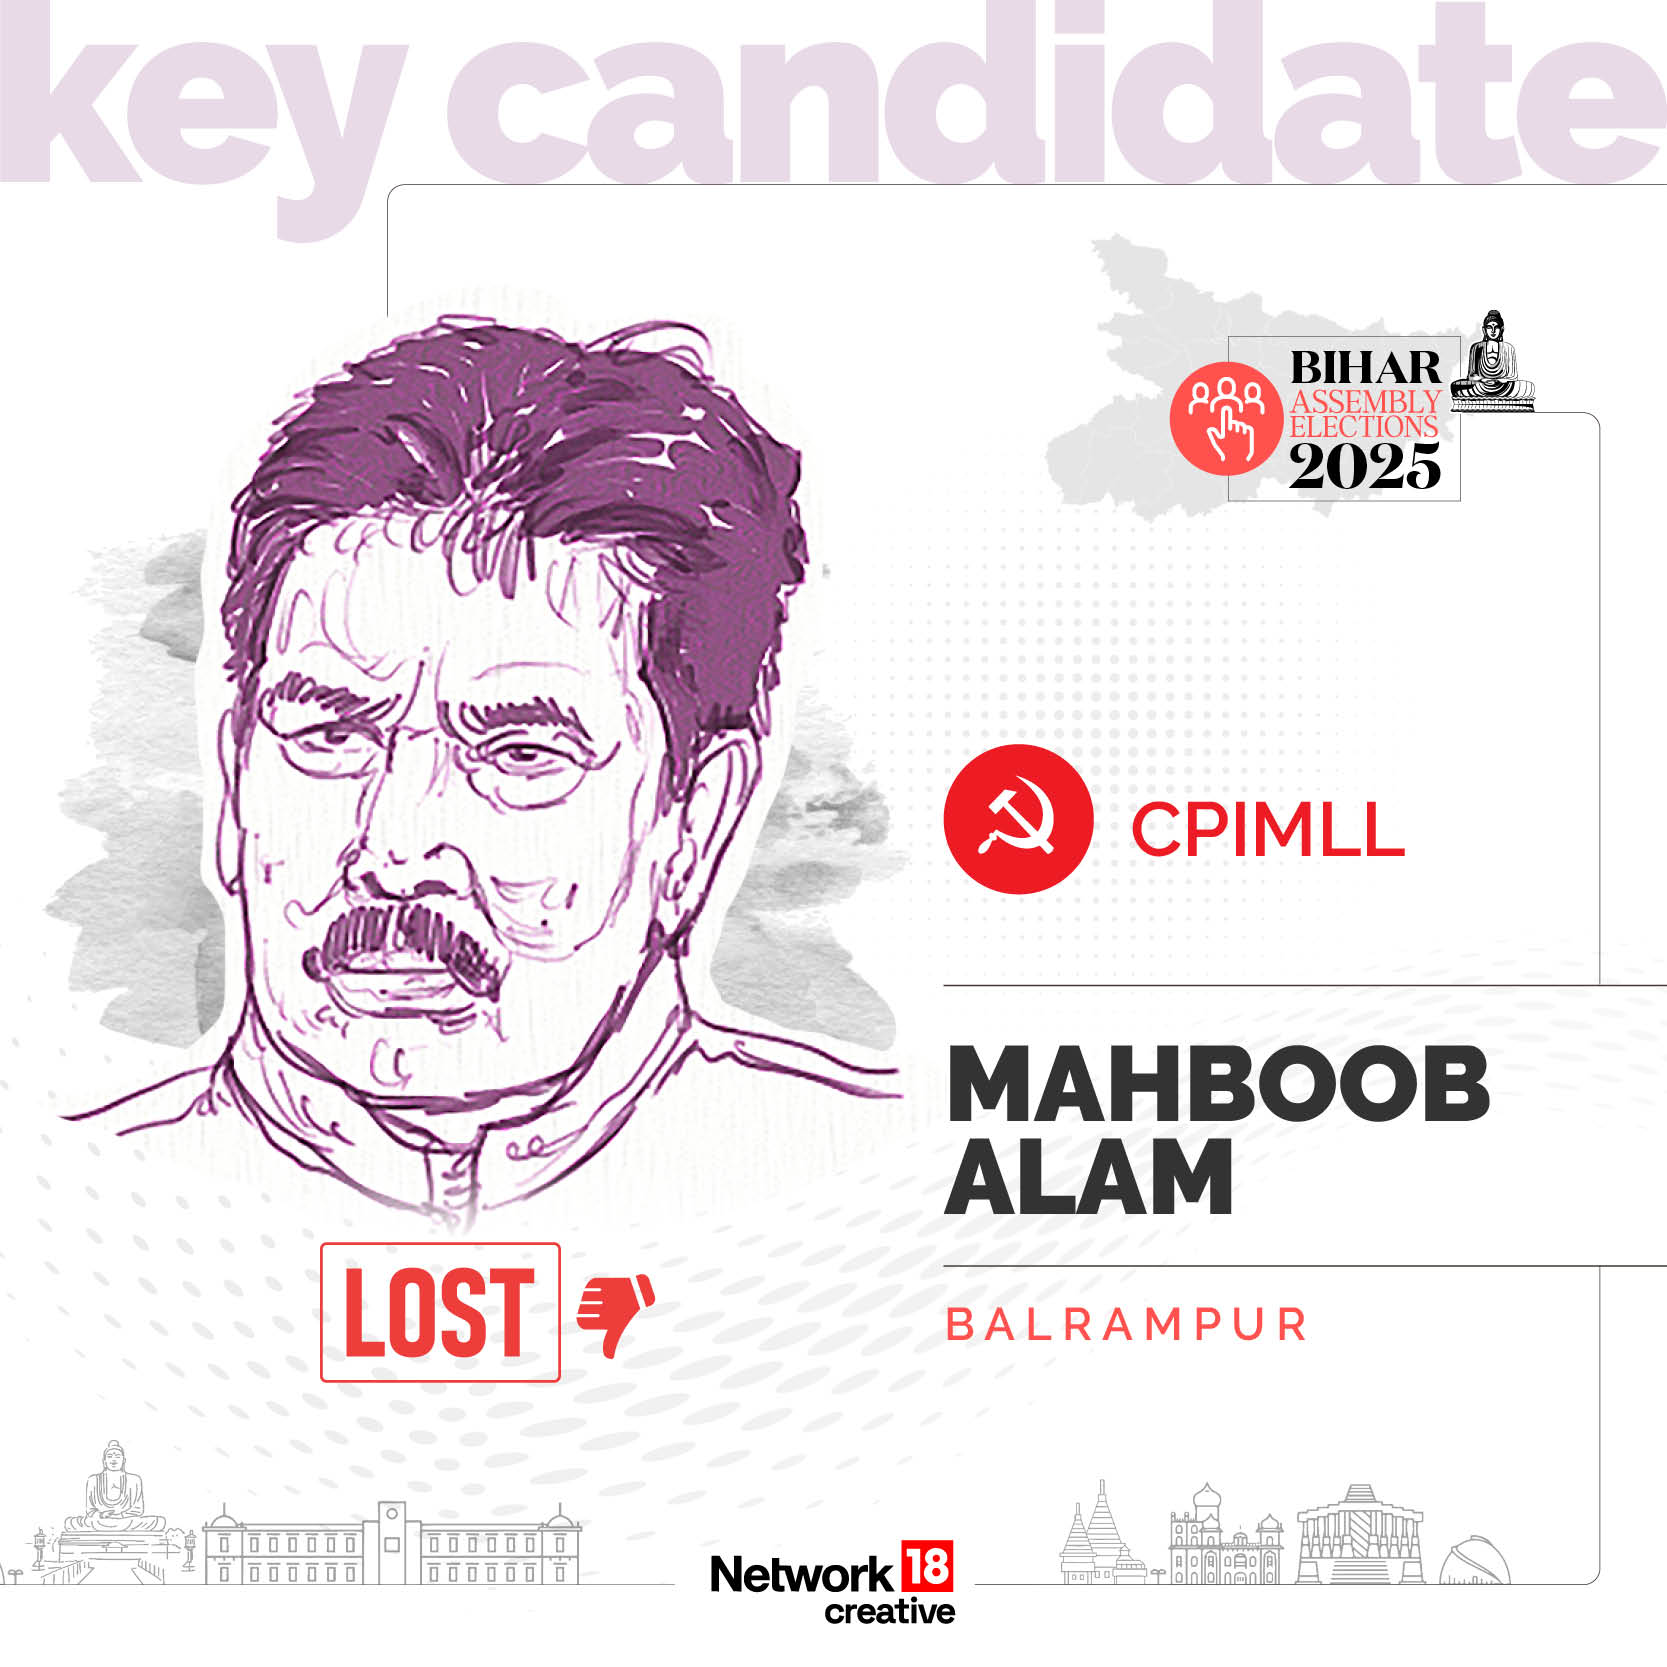
#39NOVEMBER 14, 2025 | 20:36 IST
Key Candidate - Mahboob Alam
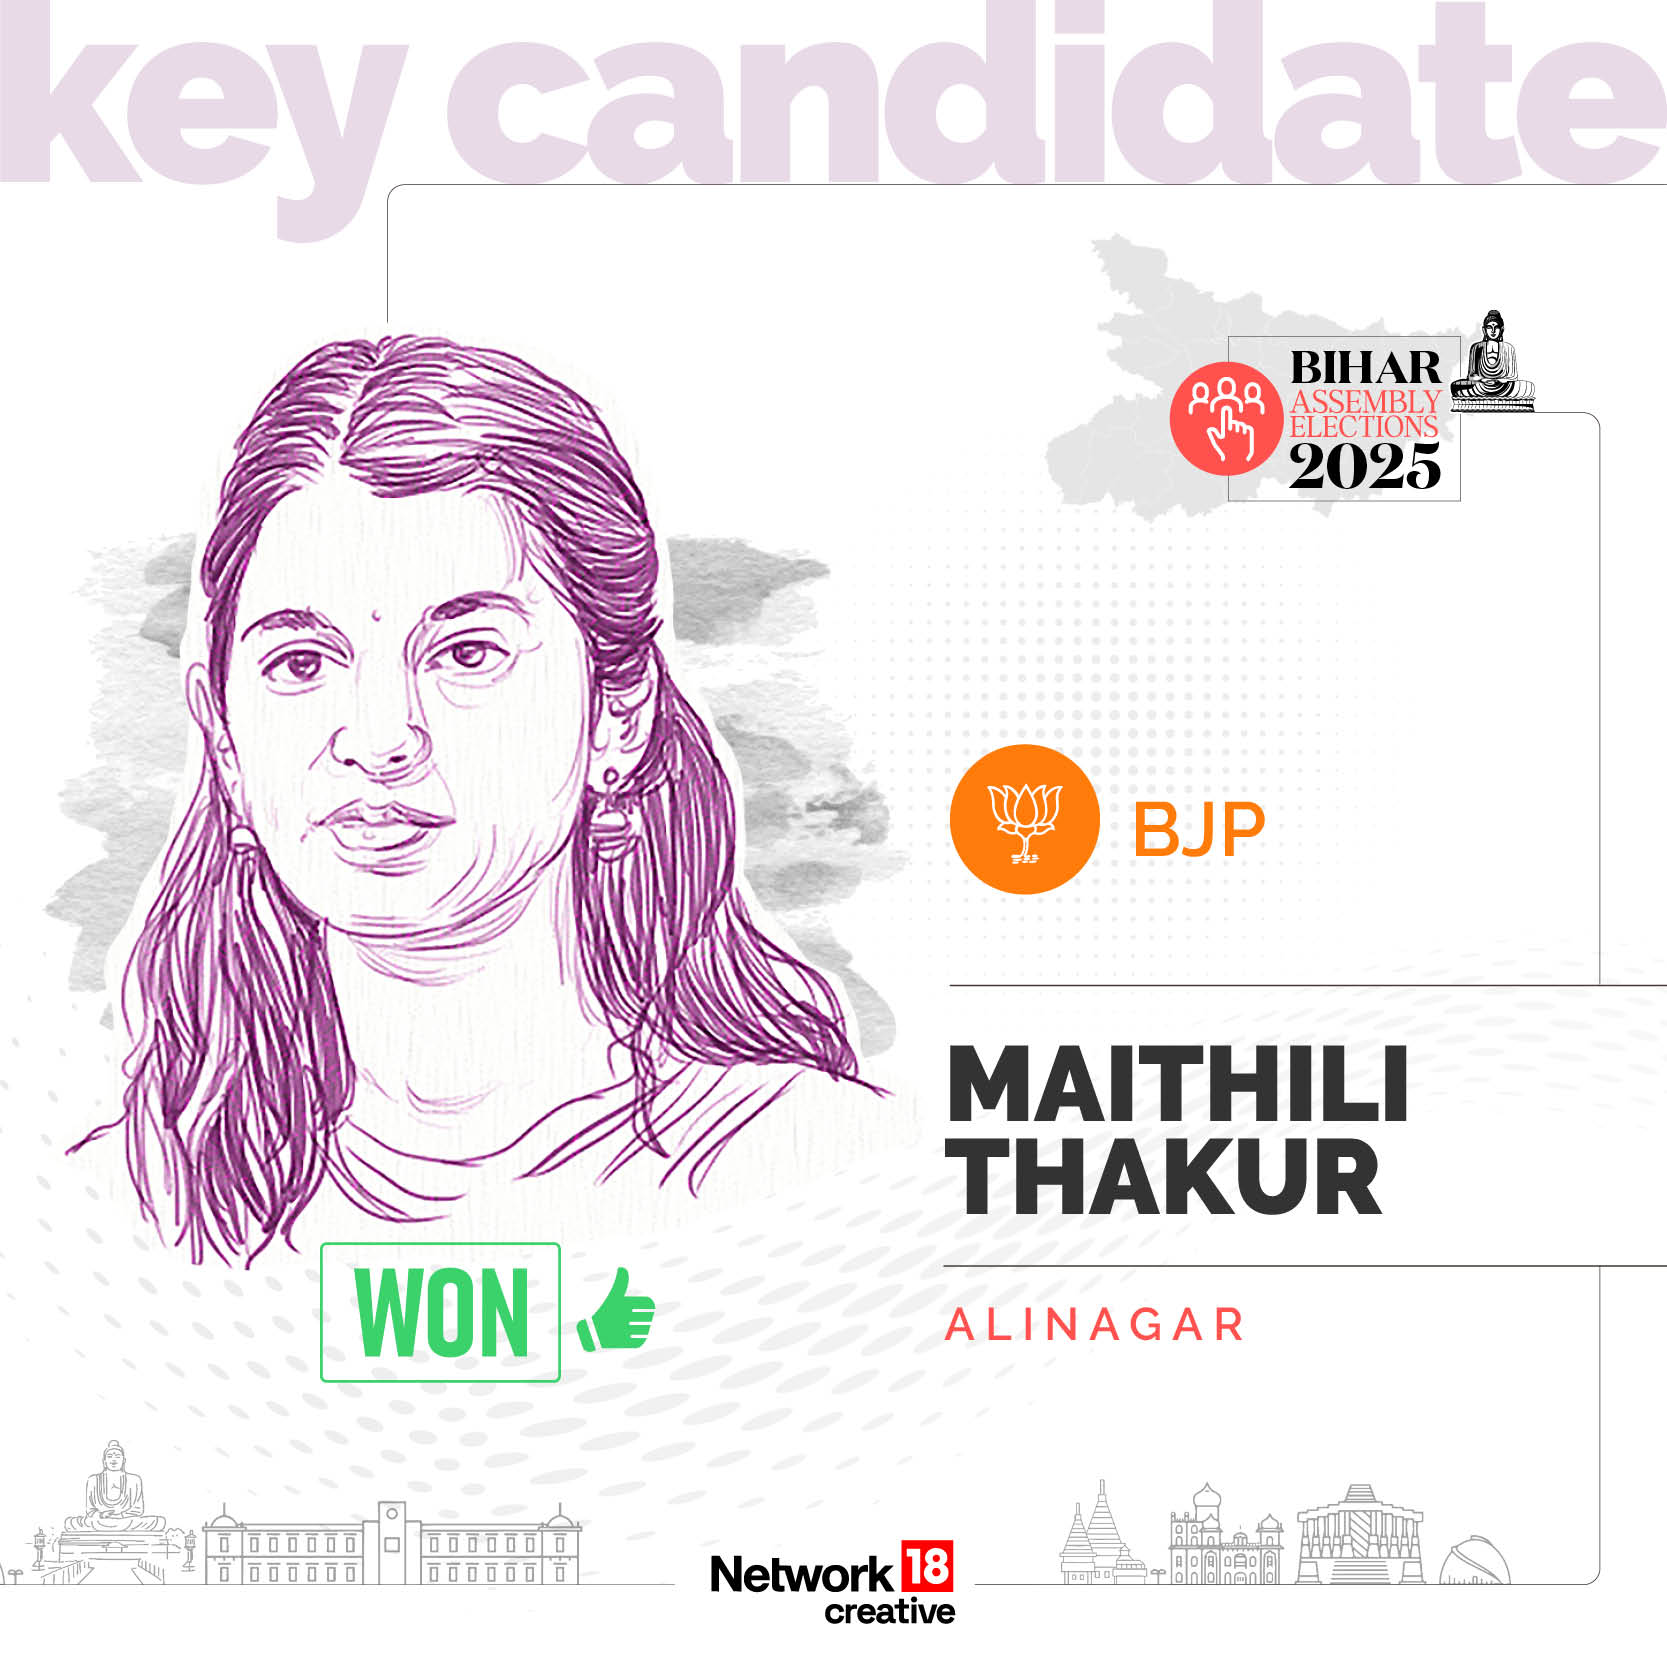
#38NOVEMBER 14, 2025 | 20:35 IST
Key Candidate - Maithili Thakur
#37NOVEMBER 14, 2025 | 20:34 IST
Key Candidate - Mangal Pandey
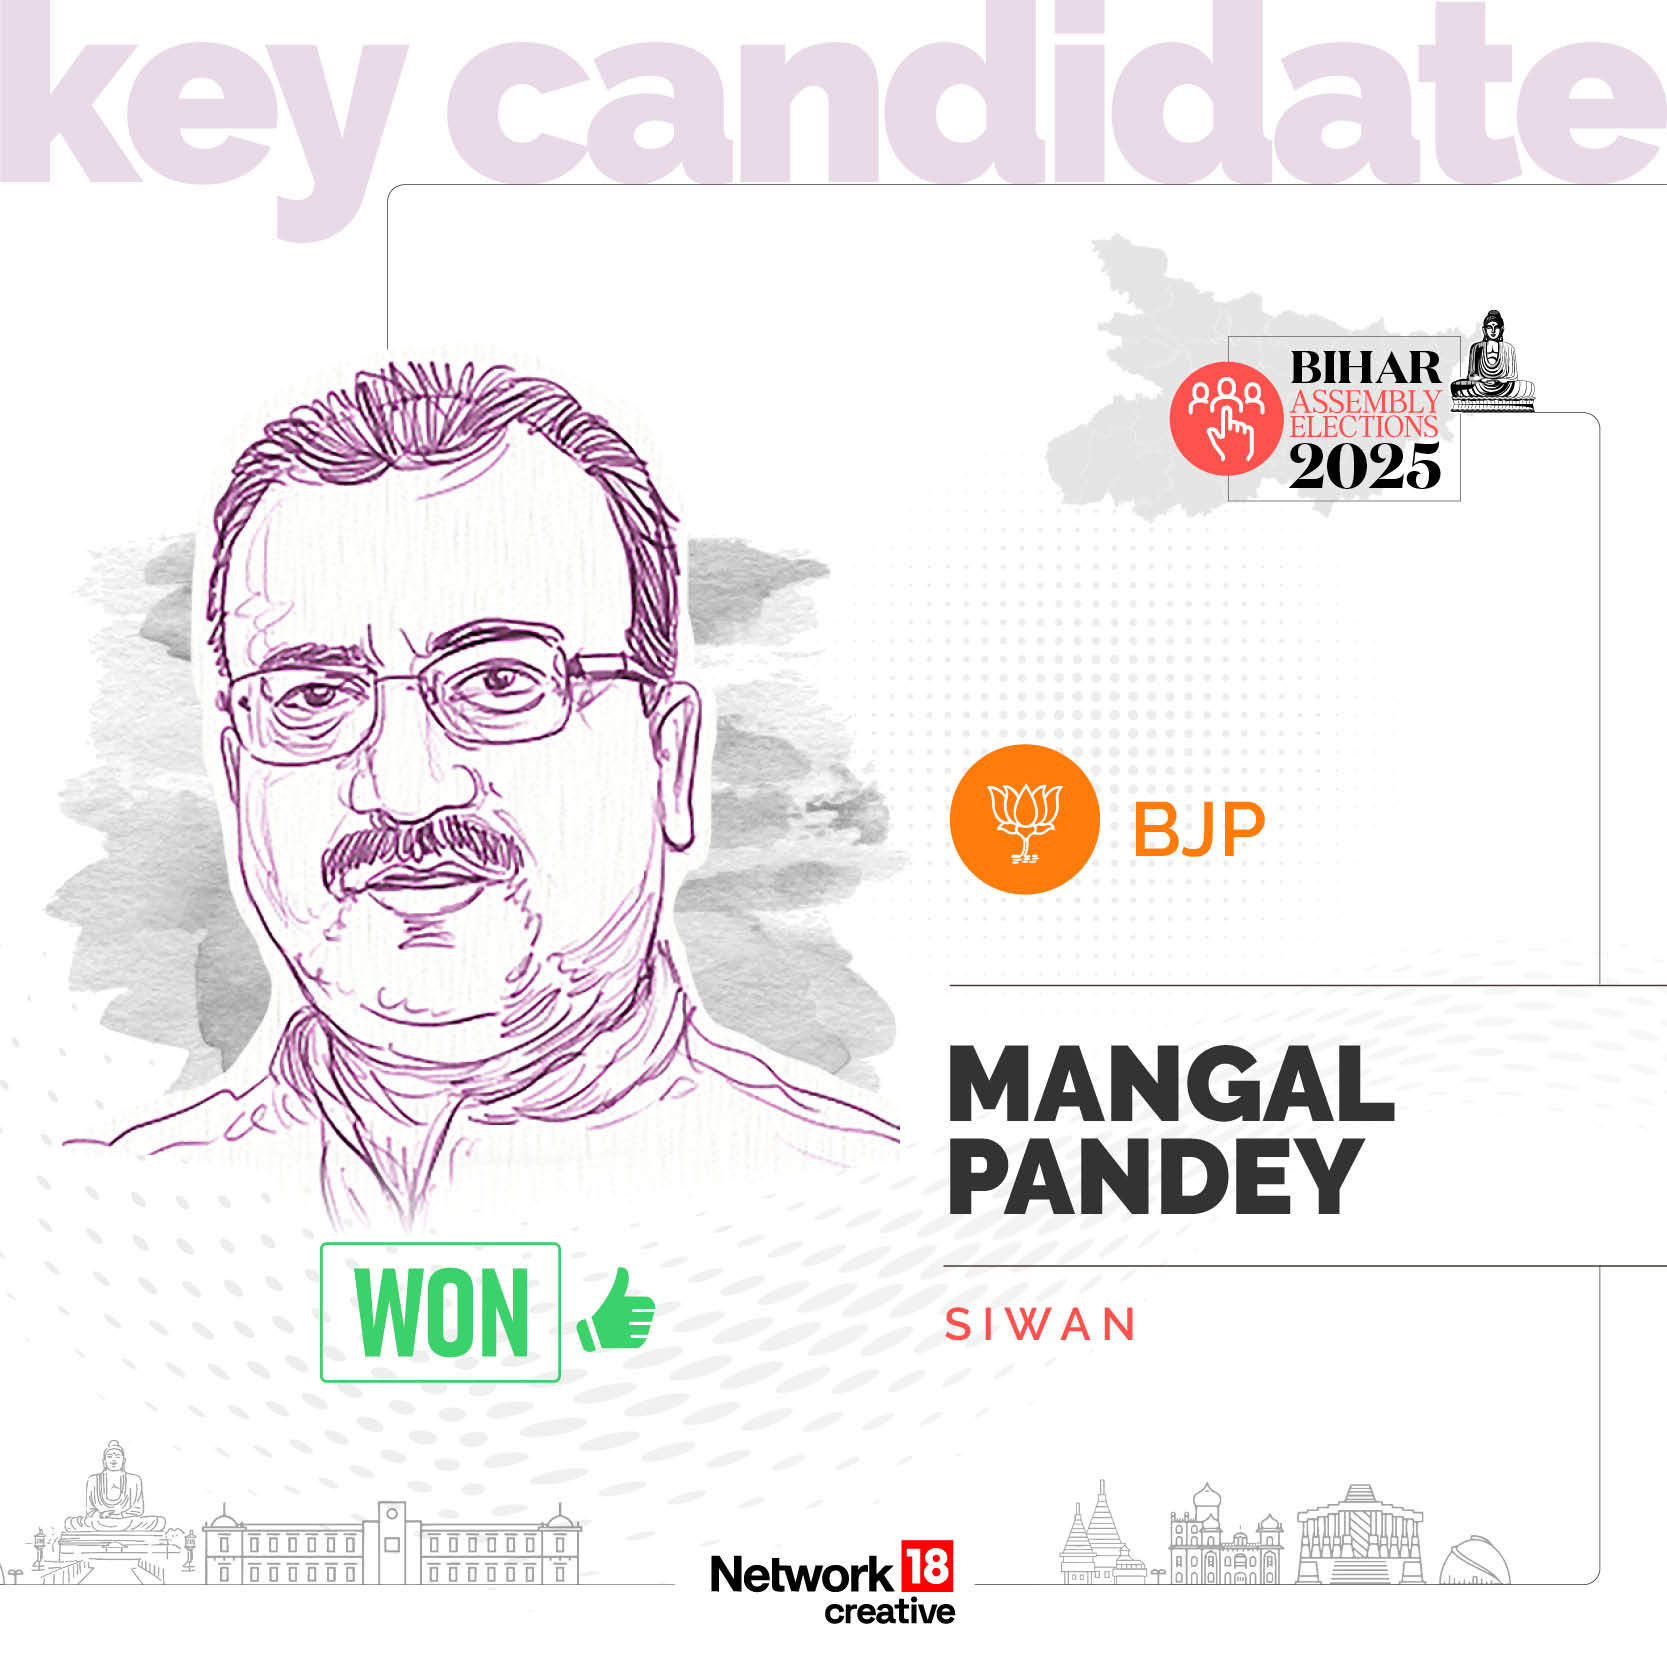
#36NOVEMBER 14, 2025 | 20:33 IST
Key Candidate - Rajesh Kumar
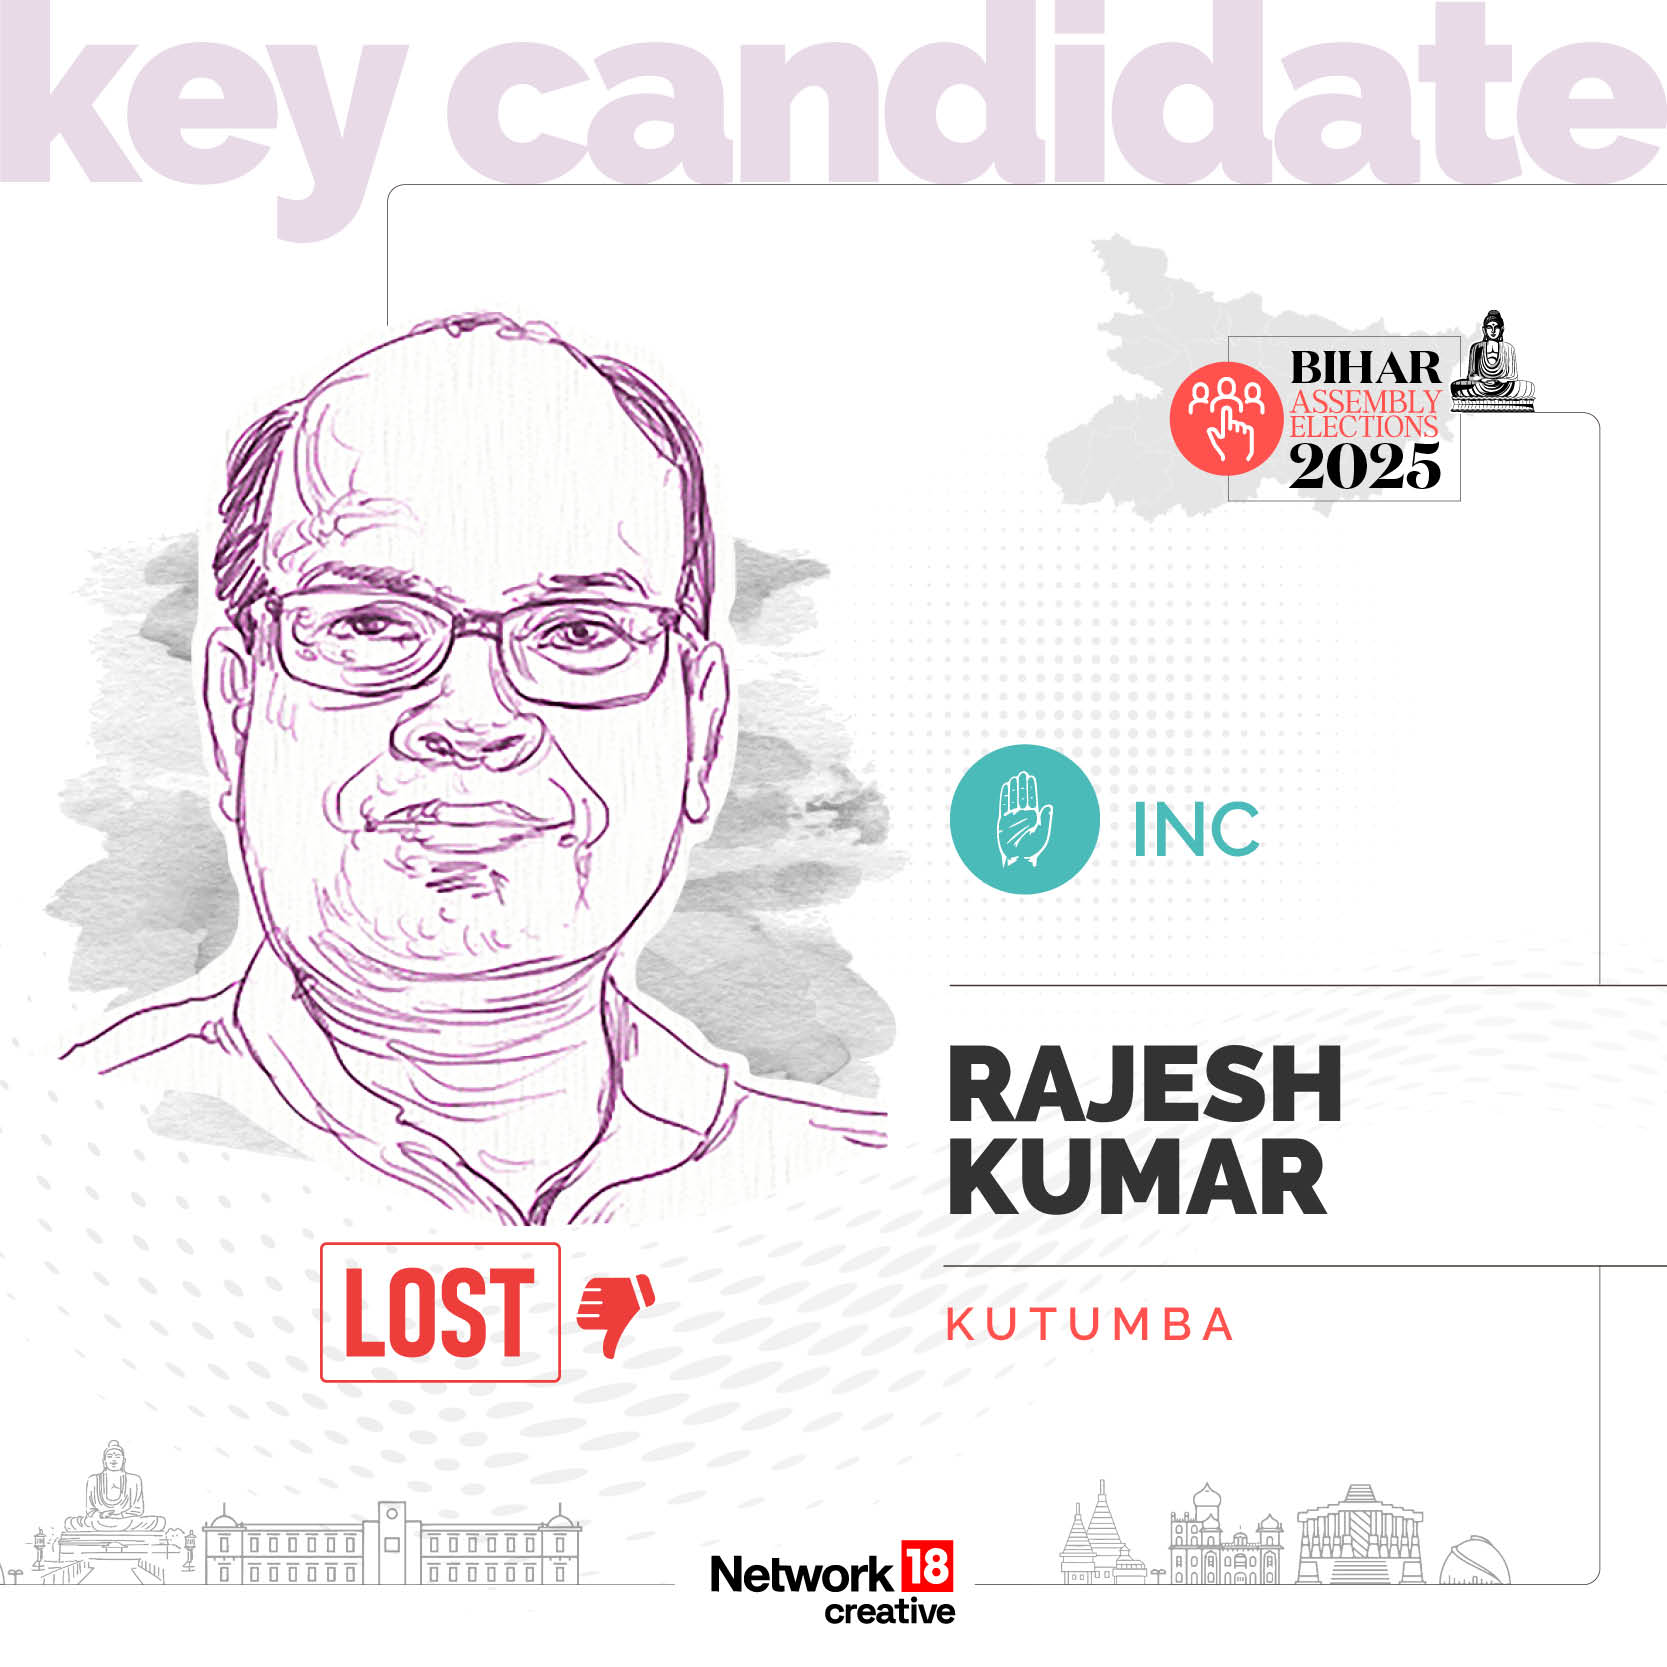
#35NOVEMBER 14, 2025 | 20:33 IST
Key Candidate - Ram Kripal Yadav
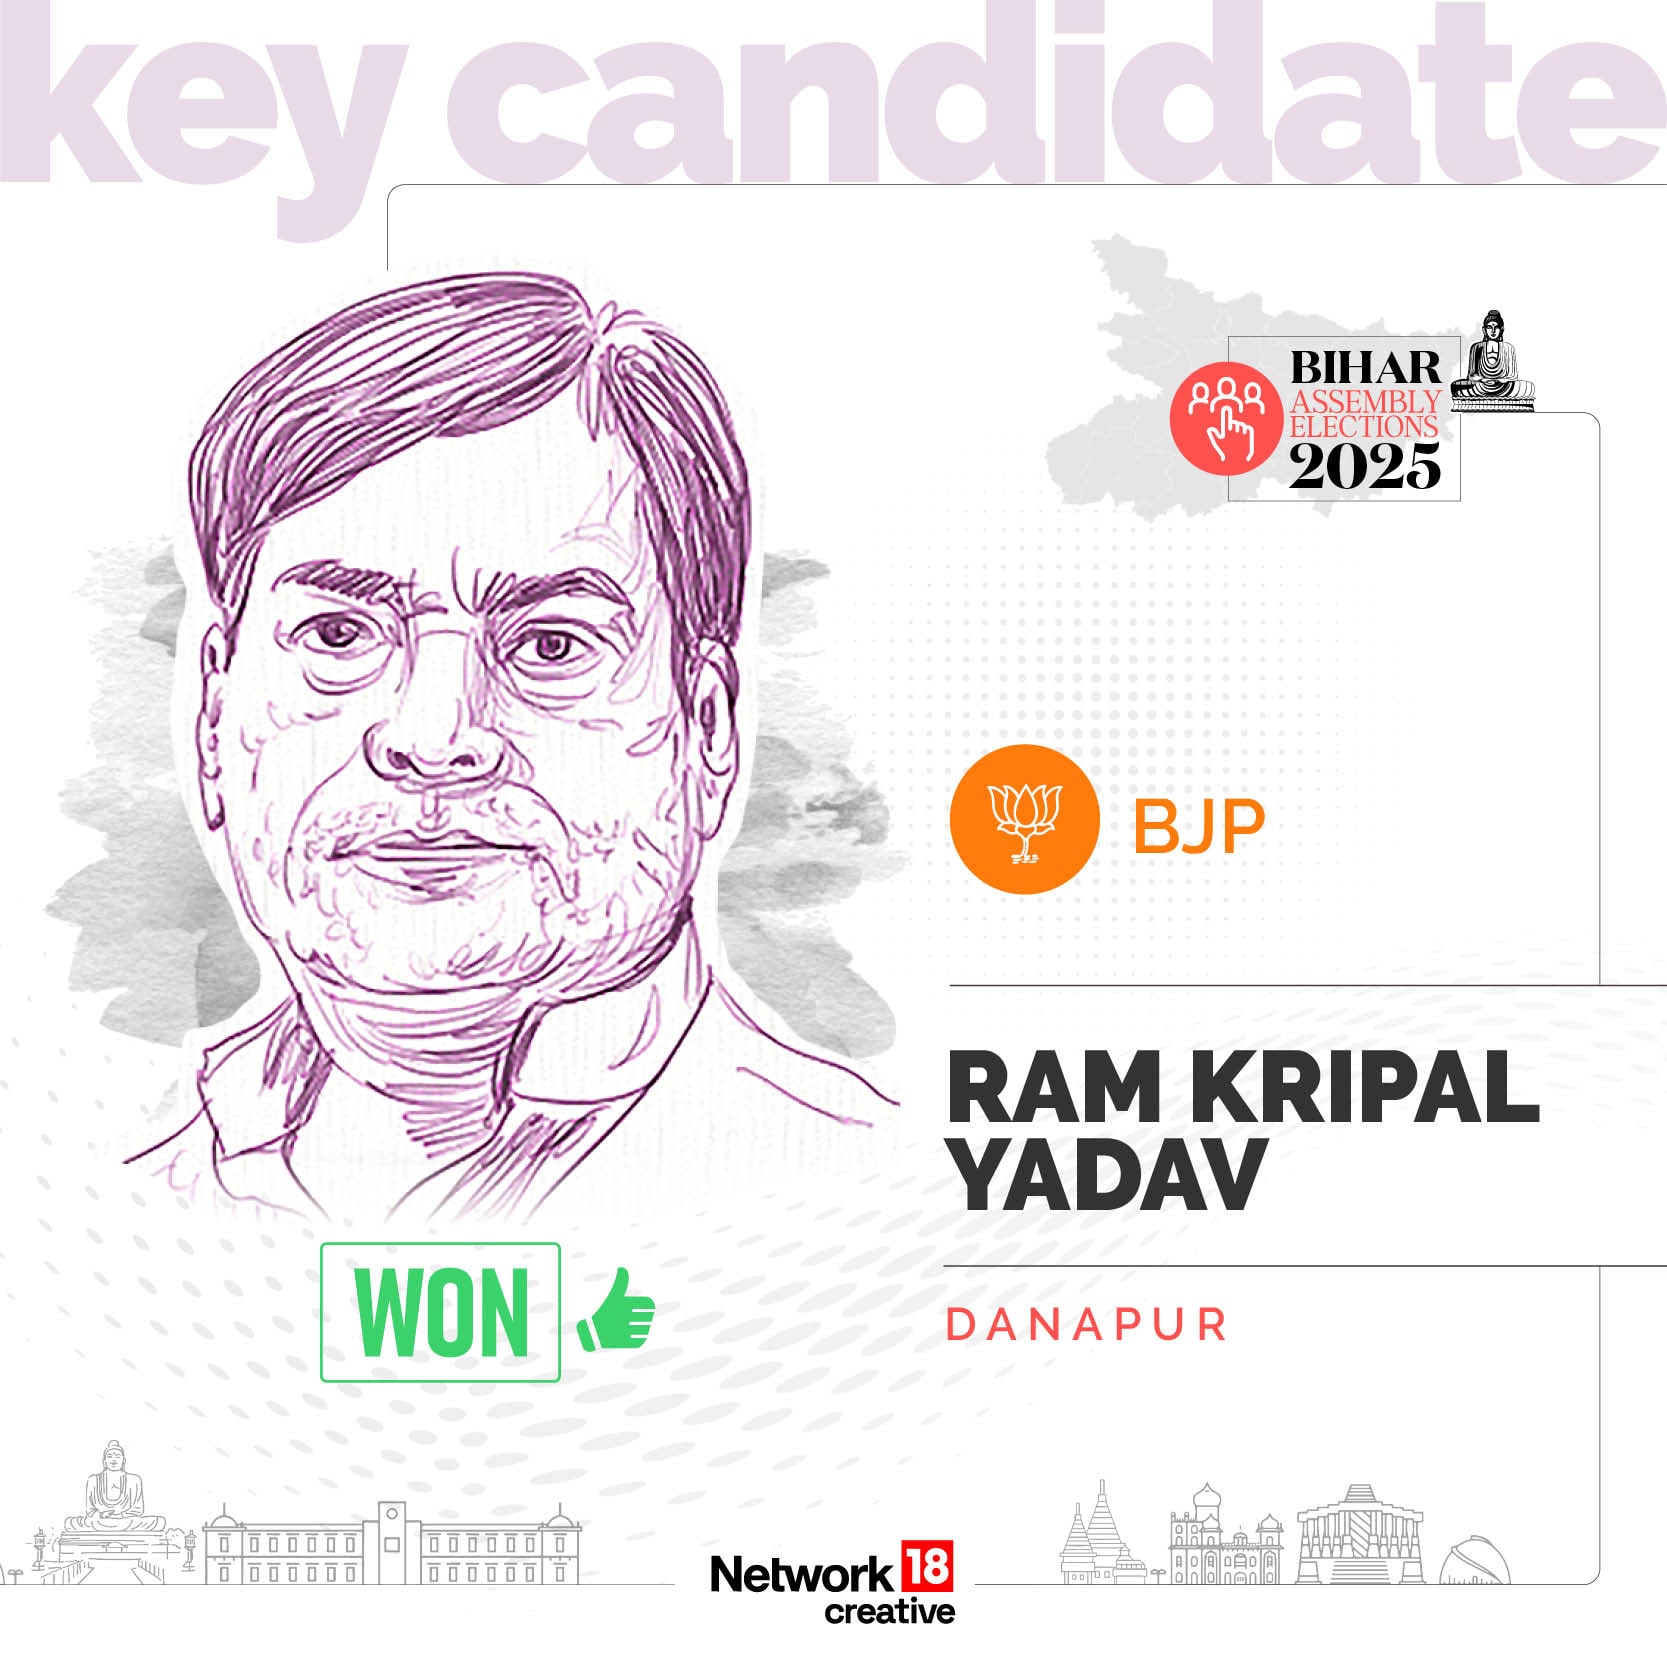
#34NOVEMBER 14, 2025 | 20:32 IST
Key Candidate - Renu Devi
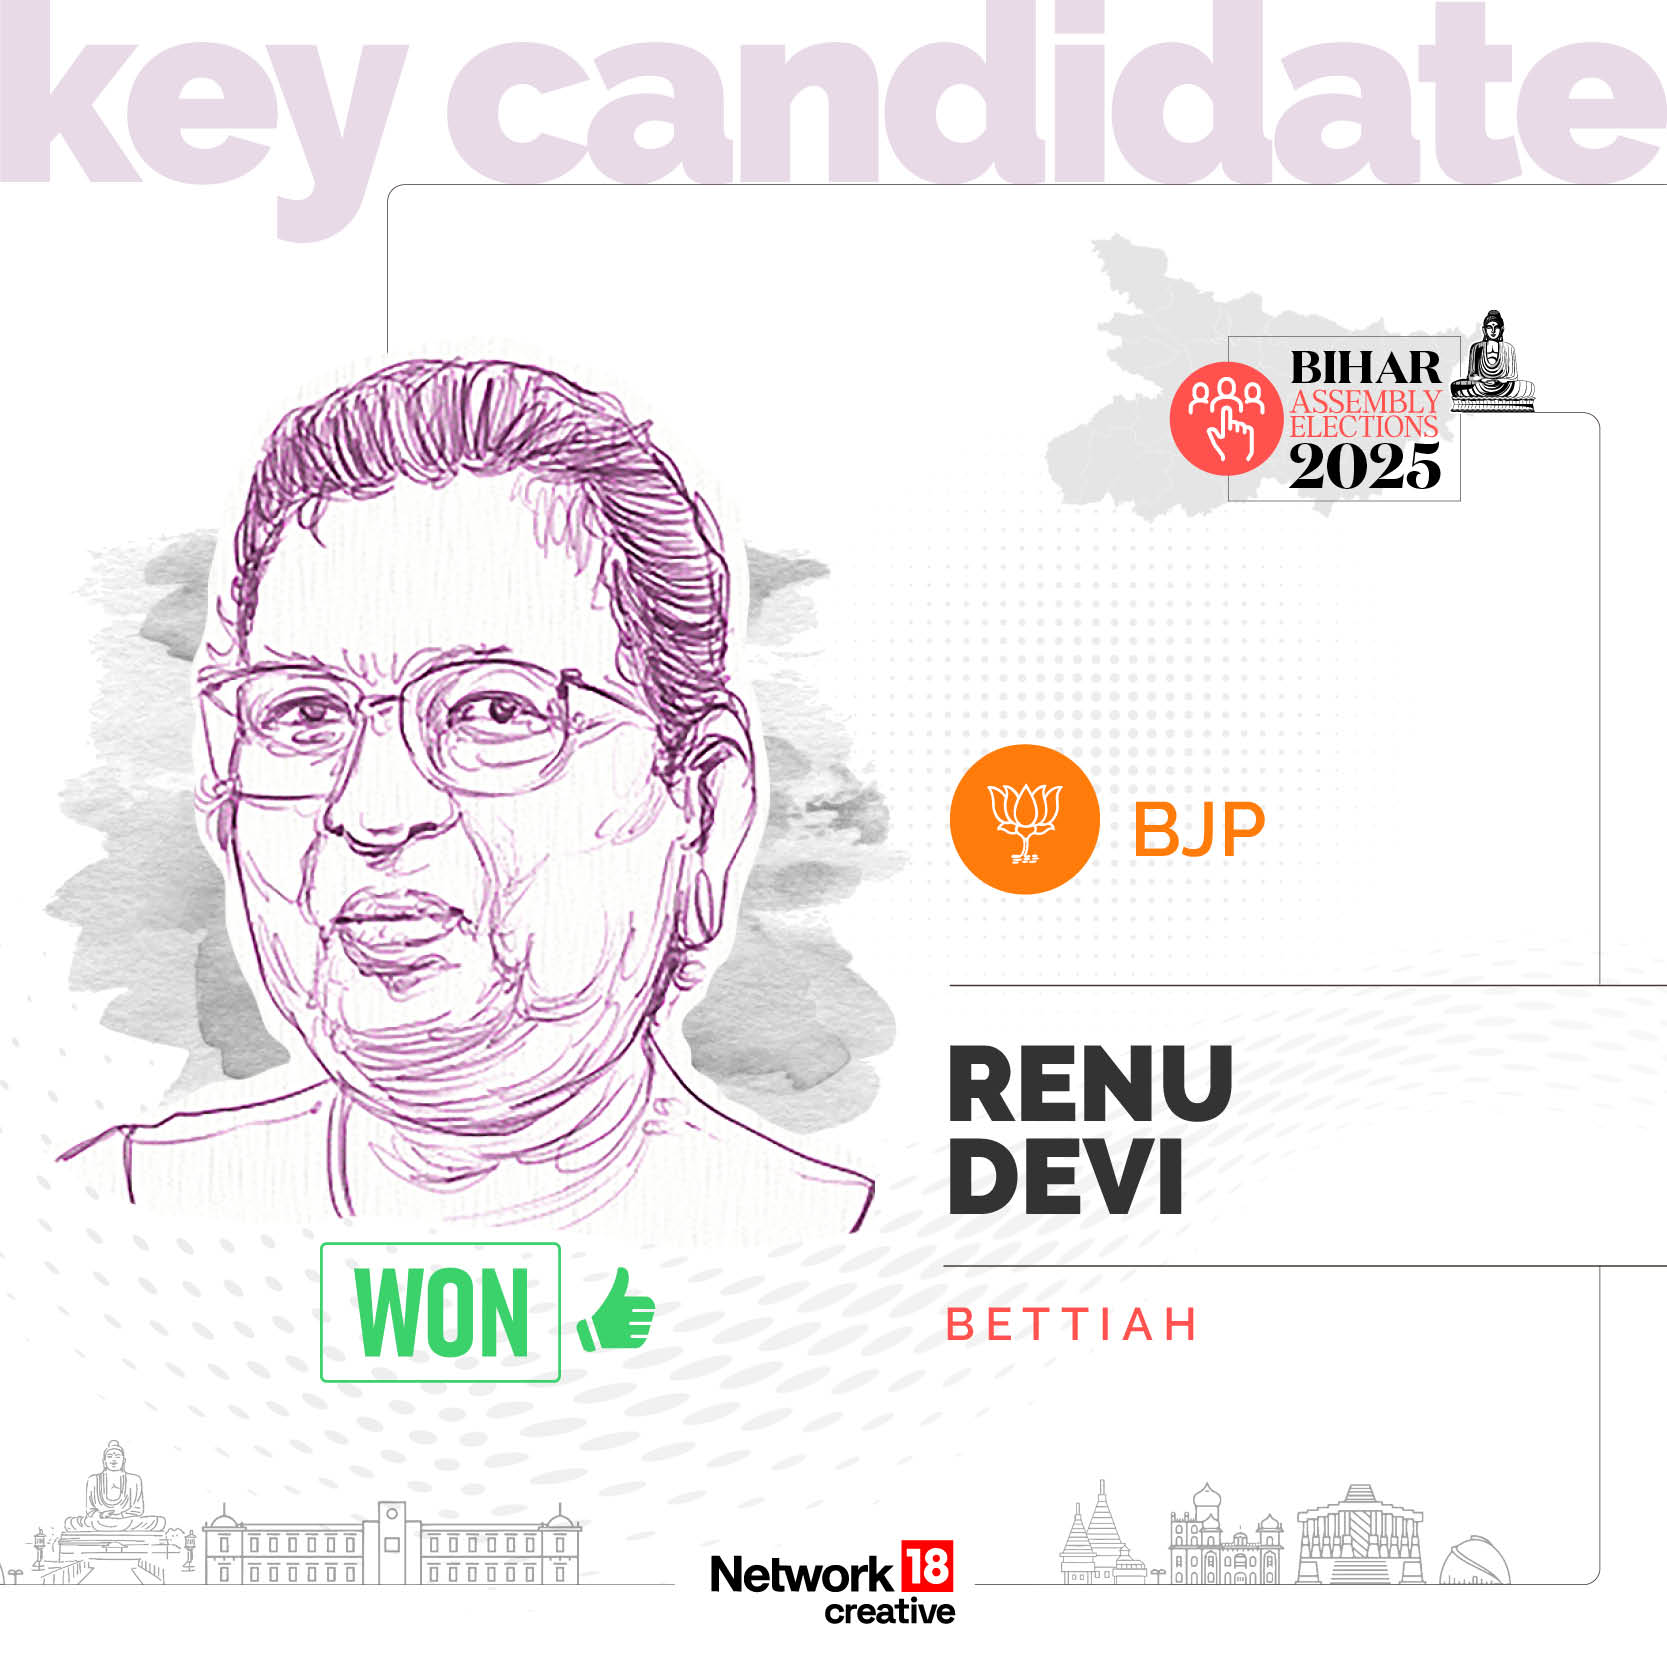
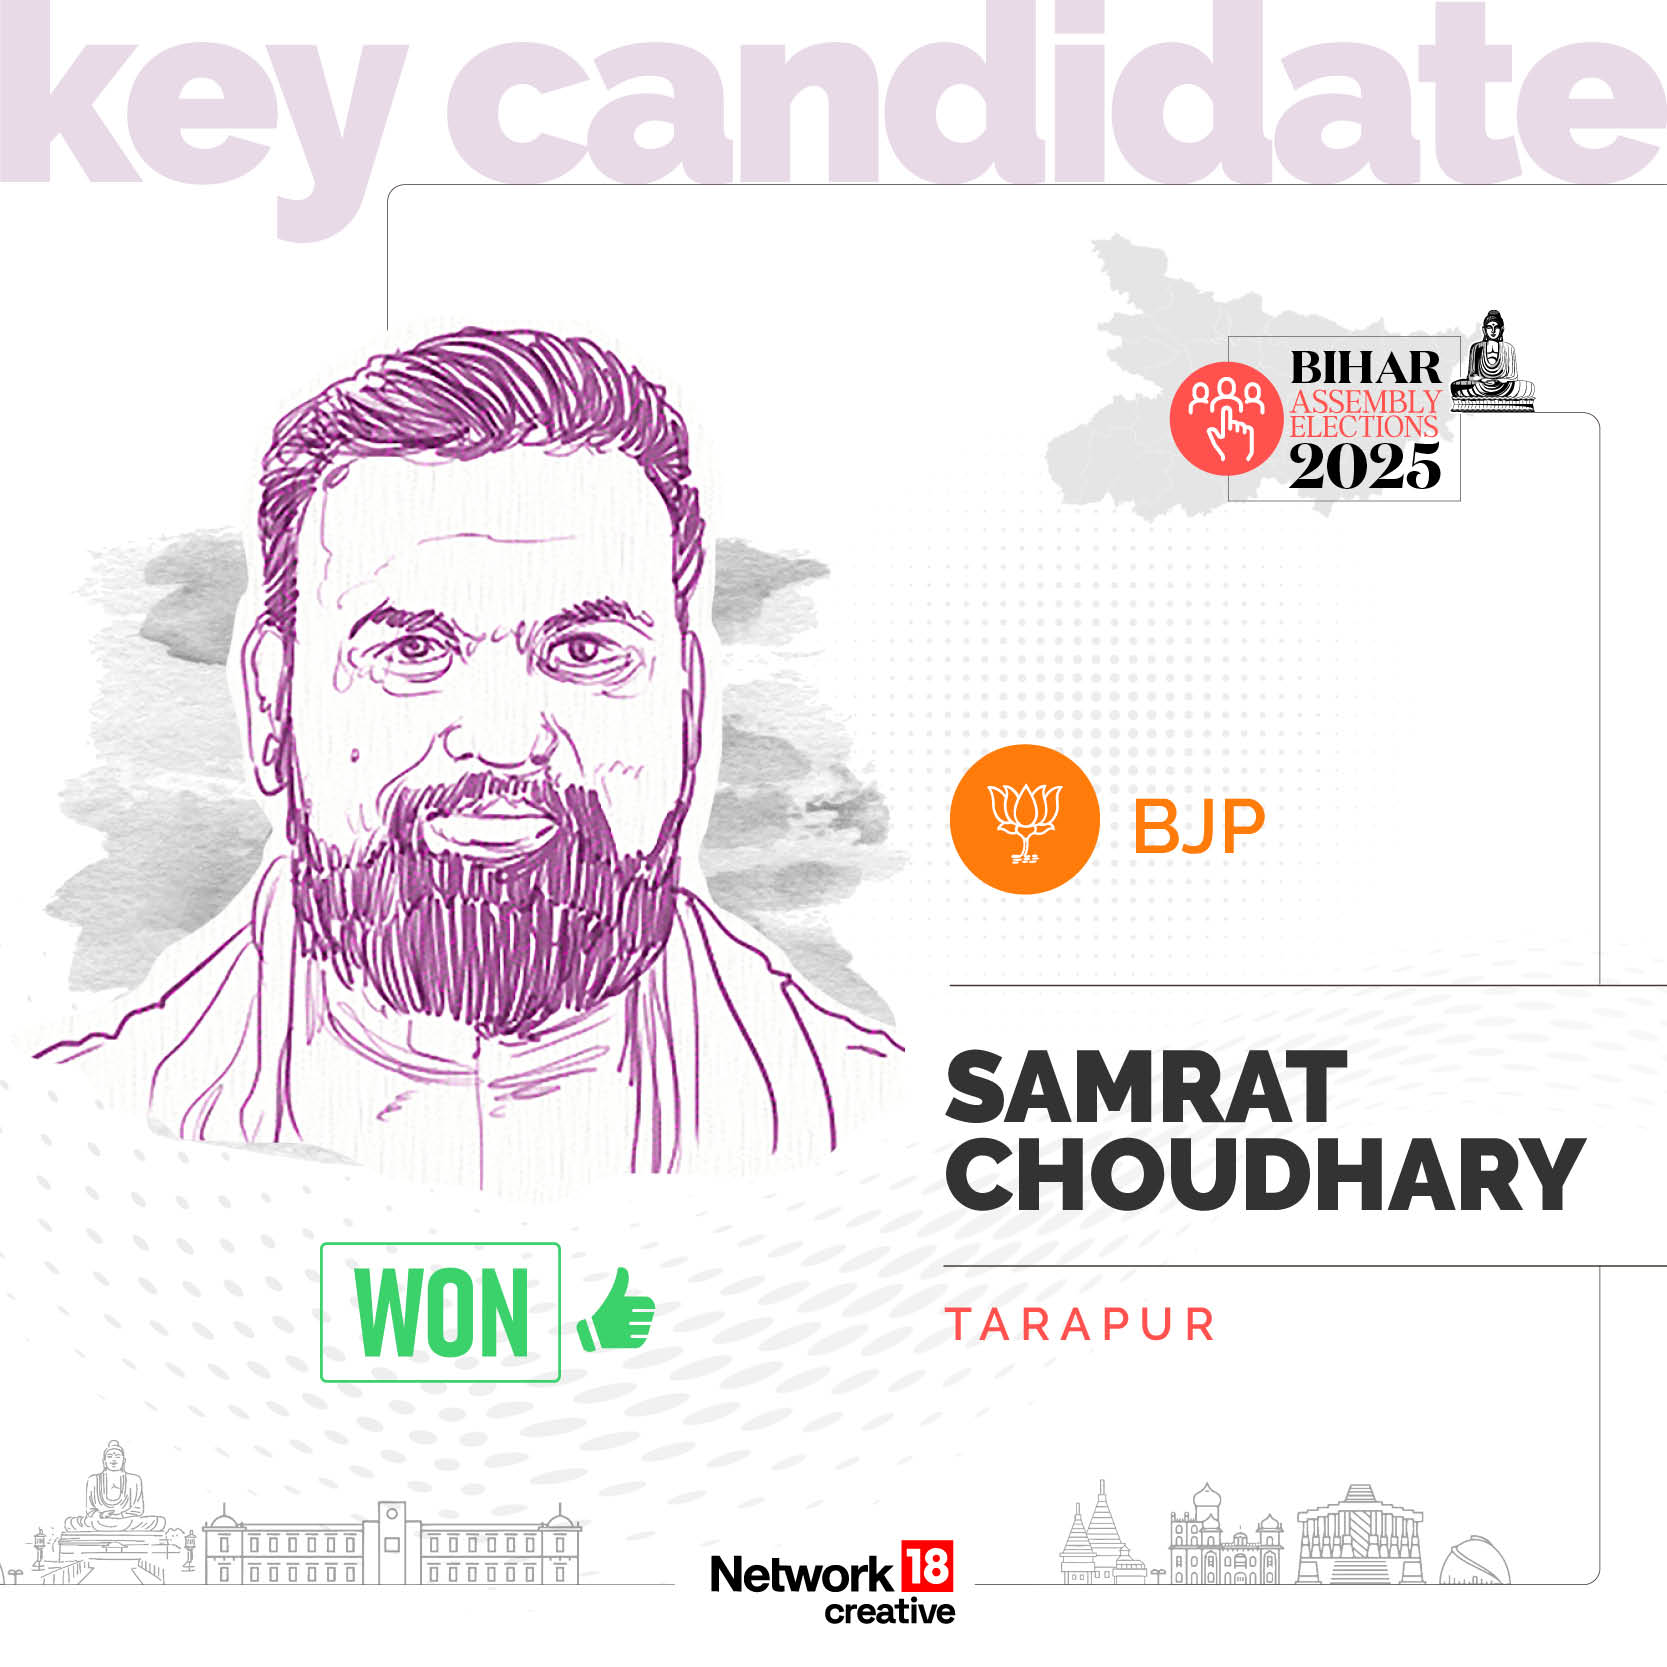
#33NOVEMBER 14, 2025 | 20:31 IST
Key Candidate - Samrat Choudhary